. 2010 Jan 19;107(3):1094-9.
doi: 10.1073/pnas.0905481107. Epub 2009 Dec 28.

Origin and temperature dependence of radiation damage in biological samples at cryogenic temperatures

Affiliations

Origin and temperature dependence of radiation damage in biological samples at cryogenic temperatures

Alke Meents et al. Proc Natl Acad Sci U S A. .

Abstract

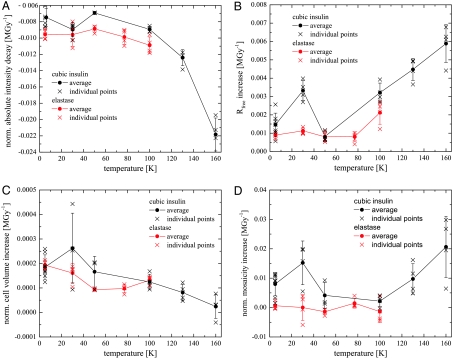
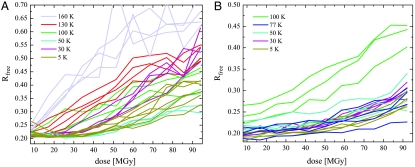
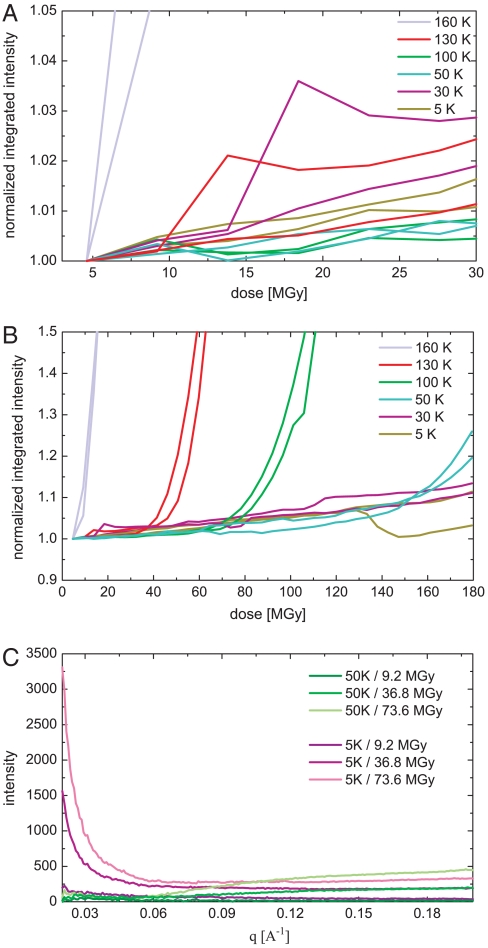
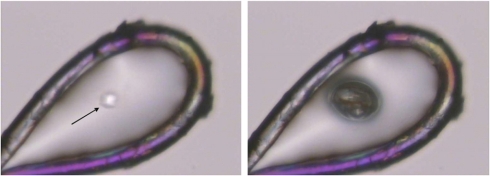
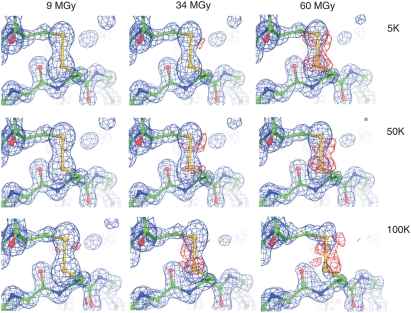
Radiation damage is the major impediment for obtaining structural information from biological samples by using ionizing radiation such as x-rays or electrons. The knowledge of underlying processes especially at cryogenic temperatures is still fragmentary, and a consistent mechanism has not been found yet. By using a combination of single-crystal x-ray diffraction, small-angle scattering, and qualitative and quantitative radiolysis experiments, we show that hydrogen gas, formed inside the sample during irradiation, rather than intramolecular bond cleavage between non-hydrogen atoms, is mainly responsible for the loss of high-resolution information and contrast in diffraction experiments and microscopy. The experiments that are presented in this paper cover a temperature range between 5 and 160 K and reveal that the commonly used temperature in x-ray crystallography of 100 K is not optimal in terms of minimizing radiation damage and thereby increasing the structural information obtainable in a single experiment. At 50 K, specific radiation damage to disulfide bridges is reduced by a factor of 4 compared to 100 K, and samples can tolerate a factor of 2.6 and 3.9 higher dose, as judged by the increase of R(free) values of elastase and cubic insulin crystals, respectively.


Conflict of interest statement

The authors declare no conflict of interest.

Figures

Fig. 1.
Fig. 1.
(AD) Changes of different diffraction data quality indicators with dose as function of temperature for cubic insulin (black) and elastase (red): (A) Mean intensity decay per MGy in the 1.5–2.5 Å resolution shell, (B) increase of the Rfree values with dose obtained from the structure refinements of the intensity datasets, (C) normalized unit cell expansion, and (D) normalized crystal mosaicity. Each cross in graphs AD corresponds to data from one crystal. The solid line connects mean decay values at each temperature with its standard deviation.
Fig. 2.
Fig. 2.
Increase of the Rfree factors of cubic insulin (A) and elastase crystals (B) with dose for the different data collection temperatures.
Fig. 3.
Fig. 3.
Integrated and normalized SAXS intensities of cubic insulin crystals as function of dose for different dose regimes (A and B). The intensities are integrated over q ranging from 0.02 to 0.27 -1 and are shown for 5 K (purple), 30 K (blue), 50 K (green), 100 K (yellow), 130 k (orange) and 160 K (red). Each line represents data from one crystal. (C) Small-angle scattering difference pattern of cubic insulin crystals as function of q[-1] and with increasing dose for measurements at 5 K (purple) and 50 K (green).
Fig. 4.
Fig. 4.
X-ray irradiation of an insulin microcrystal. Left: The crystal (arrow) has been harvested from a drop containing ethylene glycol by using a nylon loop before it was exposed to a highly brilliant synchrotron x-ray beam at 100 K. Right: After exposure, the loop harboring the crystal was warmed up, and a gas bubble appeared at the spot where the x-ray beam had hit the crystal before. The picture shows the gas bubble at a temperature around 160 K.
Fig. 5.
Fig. 5.
Radiation induced changes in 2Fo-Fc (blue mesh, contoured at 2.0σ) and negative Fo-Fc (red mesh, contoured at 3σ) electron density difference maps of the solvent exposed disulfide bridge (Cys 7A and Cys 7B) are compared at 5 K (Top row), 50 K (Middle row), and at 100 K (Bottom row) and doses of 9, 34, and 60 MGy. Whereas specific damage is prominent at 100 K at absorbed x-ray doses of 34 and 60 MGy, it is less pronounced at 5 and 50 K at the same absorbed doses.
Fig. 6.
Fig. 6.
Damage to the crystal lattice at temperatures of 50 K and higher and at 30 K and below: At temperatures between 50–160 K, the hydrogen formed inside the sample as a result of x-ray irradiation can diffuse inside the crystal. It probably accumulates at grain boundaries and other lattice imperfections, resulting in an increase of the crystals macromosaicity. In an SAXS experiment such macromosaicity would give rise to a signal at smaller q-values than covered by our experiment and hence could not be observed. Reducing the temperature reduces the space occupied by the gas and hence the mosaicity increase is reduced at lower temperatures (Left). Further lowering of the temperature below 50 K drastically limits the mobility of the hydrogen gas, and at 30 K the hydrogen remains locally at the place it was formed. This results in a much stronger increase of the unit cell dimensions leading to microcracks in the crystal. This loss of short range order negatively affects the diffraction properties especially at higher resolution and compensates the positive effect of reduced damage to the molecules (Right).

Similar articles

Cited by

References

    1. Henderson R. Cryo-protection of protein crystals against radiation damage in electron and x-ray diffraction. Proc Roy Soc Lond B Bio. 1990;241:6–8.
    1. Nave C. Radiation damage in protein crystallography. Radiat Phys Chem. 1995;45(3):483–490.
    1. Teng T-y, Moffat K. Primary radiation damage of protein crystals by an intense synchrotron x-ray beam. J Synchrotron Radiat. 2000;7(5):313–317. - PubMed
    1. Mozumder A, Magee JL. Model of tracks of ionizing radiations for radical reaction mechanisms. Radiat Res. 1966;28(2):203–214. - PubMed
    1. Ziaja B, London RA, Hajdu J. Unified model of secondary electron cascades in diamond. J Appl Phys. 2005;97(6):064905–064909.

Publication types