. 2010 Jan 19;107(3):999-1004.
doi: 10.1073/pnas.0901851107. Epub 2009 Dec 23.

Measurement of mass, density, and volume during the cell cycle of yeast

Affiliations

Measurement of mass, density, and volume during the cell cycle of yeast

Andrea K Bryan et al. Proc Natl Acad Sci U S A. .

Abstract

Cell growth comprises changes in both mass and volume--two processes that are distinct, yet coordinated through the cell cycle. Understanding this relationship requires a means for measuring each of the cell's three basic physical parameters: mass, volume, and the ratio of the two, density. The suspended microchannel resonator weighs single cells with a precision in mass of 0.1% for yeast. Here we use the suspended microchannel resonator with a Coulter counter to measure the mass, volume, and density of budding yeast cells through the cell cycle. We observe that cell density increases prior to bud formation at the G1/S transition, which is consistent with previous measurements using density gradient centrifugation. To investigate the origin of this density increase, we monitor relative density changes of growing yeast cells. We find that the density increase requires energy, function of the protein synthesis regulator target of rapamycin, passage through START (commitment to cell division), and an intact actin cytoskeleton. Although we focus on basic cell cycle questions in yeast, our techniques are suitable for most nonadherent cells and subcellular particles to characterize cell growth in a variety of applications.


Conflict of interest statement

The authors declare no conflict of interest.

Figures

Fig. 1.
Fig. 1.
Illustration of instrument and cell measurement. (A) The cantilever vibrates in and out of plane with an amplitude of a few hundred nanometers. Cells flowing through the vibrating cantilever microchannel displace a volume of fluid equal to their own volume and, at a given position, change the cantilever’s resonant frequency proportional to this change in cantilever mass. The flow rates are controlled by pressure. The number of single-cell measurements was maximized by adjusting the sample concentration. A more detailed description of the instrument and its operation is available in ref. . (B) The frequency shift as cells flow through the microchannel (four of which are shown) is position-dependent, and the maximum frequency shift, which is proportional to the recorded buoyant mass, occurs when the cell is at the cantilever tip. The frequency returns to baseline upon each cell’s exit from the cantilever.
Fig. 2.
Fig. 2.
Cell density, mass, and volume measurements. Cell density is calculated by the linear relationship between buoyant mass and fluid density (red line, equation in text). The slope of this line is determined by the cell volume (Inset A) and is measured by a commercial Coulter counter on the same sample loaded in the SMR. The buoyant mass (Inset B) is determined by a distribution of > 1500 SMR measurements. An example of four of these measurements made in phosphate buffer is in Fig. 1B. The means of the fitted log-normal functions (X on Insets) are used to calculate average cell density.
Fig. 3.
Fig. 3.
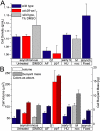
Density, buoyant mass, and volume of cells synchronized by cell cycle blocks. (A) WT (A2587) and cdc28-as1 (A4370) densities (mean ± SD) in arrested G1 and metaphase are lower than asynchronous mock-treated (untreated, DMSO) populations. The density of the asynchronous population is approximately the same as S-phase arrested cells and reflects the unequal distribution of cells throughout the cell cycle. Cells were synchronized with alpha factor (AF) for 2 hr (5 μM), 1-NM-PP1 (pp1) CDK inhibitor for 3 hr (5 μM), hydroxyurea (HU) for 2 hr (10 mg/mL), and nocodazole (NOC) for 2 hr (15 μg/mL), as indicated. Fixed cells were fixed in 3.7% formaldehyde for various amounts of time. (B) Buoyant mass (ρf = ρwater,20 °C) and volume measurements for the same cell populations (mean ± SD).
Fig. 4.
Fig. 4.
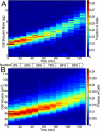
Density, buoyant mass, and volume of cells synchronized by elutriation. (A) Density of formaldehyde-fixed-cell populations (A11311) grown overnight in YEP + 2% raffinose and a synchronized sample was selected by centrifugal elutriation. Bud counts are reported as percent budded in brackets next to each measurement. Cells begin to enter S phase between 60 and 120 min. Error bars are the SEM measured with a single fixed sample of elutriated WT cells (A11311, n = 3). (B) Buoyant mass (ρf = ρwater,20 °C) and volume increase throughout the time course. Changes in cell density at the population level are the result of differences in the relative rates of mass and volume increase through the cell cycle.
Fig. 5.
Fig. 5.
Buoyant mass and volume growth rates are cell cycle-dependent. Color designates the fraction of the population with the indicated buoyant mass and volume (color bar at right). Small unbudded cells (A2587) were isolated by elutriation for synchronous culture after overnight growth in YEPD, which partially reduced synchrony. (A) The SMR steadily sampled from the culture and measurements were broken into 10-min divisions (n = 7,839 cells). (B) Volume measurements on a split culture were made from aliquots drawn at 10-min intervals and recorded in < 1 min (n = 67,607 cells). Additional budding data is available in Fig. S1.
Fig. 6.
Fig. 6.
Real-time relative cell density measurement. Cell state, distinguished by cell density, is determined by the cell’s direction of frequency shift in media with a density slightly above that of G1 cells. G1-synchronized cells have a negative buoyant mass (positive frequency shift), and cells entering S phase at a later time point have a positive buoyant mass (negative frequency shift). The proportion of cells in each state is directly correlated to the percent of cells below or above fluid density and changes as cells synchronously progress through the cell cycle.
Fig. 7.
Fig. 7.
Changes in cell density require energy, TOR function, passage through START, and an intact cytoskeleton. WT cells (A2587) were arrested in alpha factor and released in YEPD:Percoll media with each treatment. Increases in the percent of cells with a density above that of the fluid signify an overall increase in cell density. (A) Azide (0.1% wt/vol) prevented the density change and demonstrates an energy requirement for the density increase. Mock-treatment: equal volume water. (B) Rapamycin (10 μM) prevented the density change and establishes a TOR function requirement. Mock-treatment: equal volume 70% ethanol. (C) Alpha factor (5 μM) prevented the density change and confirms a passage through START requirement. Mock-treatment: equal volume DMSO. (D) LatA (100 μM) prevented the density change and establishes a requirement for an intact actin cytoskeleton. Mock-treatment: equal volume DMSO. Error bars are the standard error of the proportion. The Bonferonni-corrected significance for each treatment was p ∼ 0.01 for (A), p ∼ 0.05 for (B), p ∼ 0.04 for (C), and p ∼ 0.06 for (D).

Similar articles

Cited by

References

    1. Mitchison JM. The growth of single cells I. Schizosaccharomyces pombe. Exp Cell Res. 1957;13:244–262. - PubMed
    1. Kubitschek HE, Ward RA. Buoyant density constancy of Schizosaccharomyces pombe cells. J Bacteriol. 1985;162:902–904. - PMC - PubMed
    1. Pertoft H. Fractionation of cells and subcellular particles with Percoll. J Biochem Biophys Meth. 2000;44:1–30. - PubMed
    1. Kubitschek HE, Baldwin WW, Graetzer R. Buoyant density constancy during the cell cycle of Escherichia coli. J Bacteriol. 1983;155:1027–1032. - PMC - PubMed
    1. Anderson EC, Petersen DF, Tobey RA. Density invariance of cultured Chinese hamster cells with stage of the mitotic cycle. Biophys J. 1970;10:630–645. - PMC - PubMed

Publication types

LinkOut - more resources