. 2010 Feb 2;107(5):2337-42.
doi: 10.1073/pnas.0908808107. Epub 2009 Dec 22.

Live-cell imaging of photosystem II antenna dissociation during state transitions

Affiliations

Live-cell imaging of photosystem II antenna dissociation during state transitions

Masakazu Iwai et al. Proc Natl Acad Sci U S A. .

Abstract

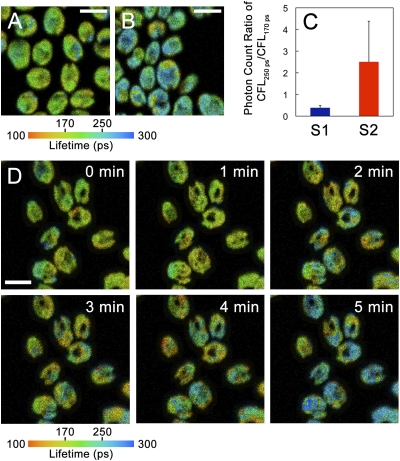
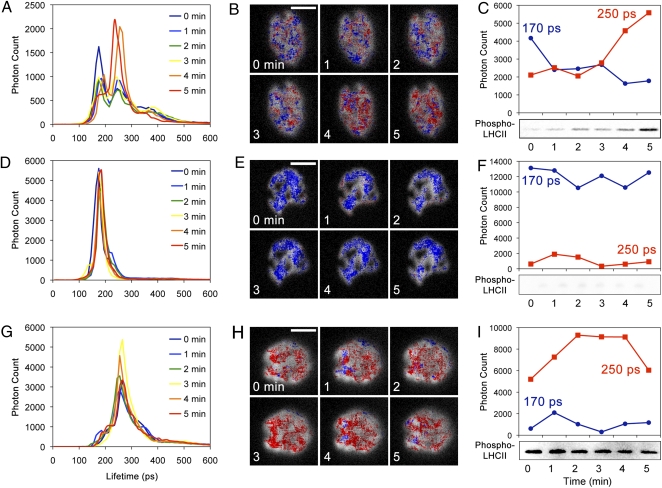
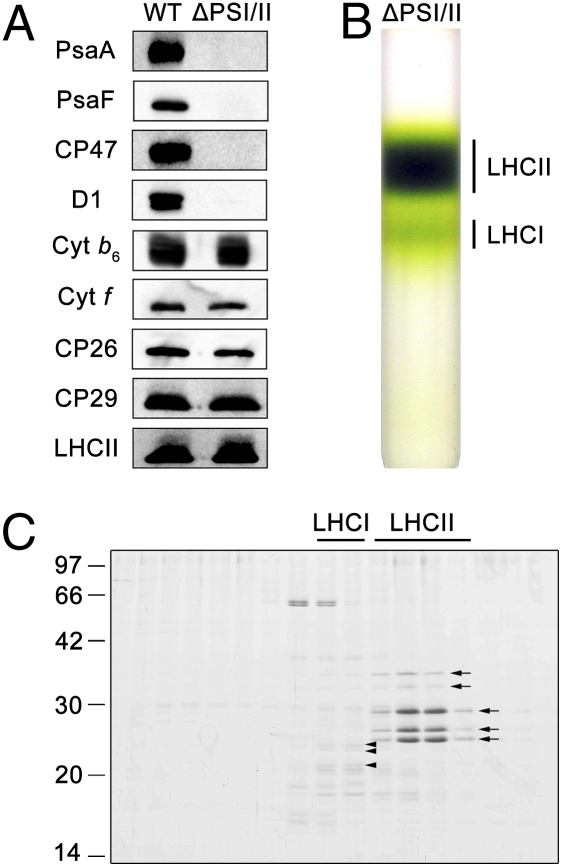
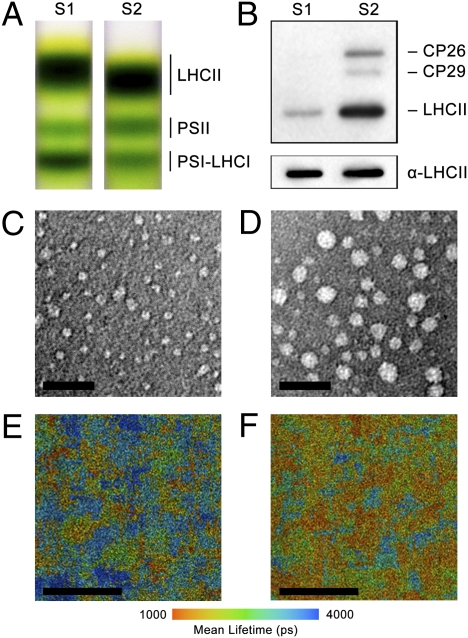
Plants and green algae maintain efficient photosynthesis under changing light environments by adjusting their light-harvesting capacity. It has been suggested that energy redistribution is brought about by shuttling the light-harvesting antenna complex II (LHCII) between photosystem II (PSII) and photosystem I (PSI) (state transitions), but such molecular remodeling has never been demonstrated in vivo. Here, using chlorophyll fluorescence lifetime imaging microscopy, we visualized phospho-LHCII dissociation from PSII in live cells of the green alga Chlamydomonas reinhardtii. Induction of energy redistribution in wild-type cells led to an increase in, and spreading of, a 250-ps lifetime chlorophyll fluorescence component, which was not observed in the stt7 mutant incapable of state transitions. The 250-ps component was also the dominant component in a mutant containing the light-harvesting antenna complexes but no photosystems. The appearance of the 250-ps component was accompanied by activation of LHCII phosphorylation, supporting the visualization of phospho-LHCII dissociation. Possible implications of the unbound phospho-LHCII on energy dissipation are discussed.


Conflict of interest statement

The authors declare no conflict of interest.

Figures

Fig. 1.
Fig. 1.
Measurement of CFL in live C. reinhardtii WT cells in states 1 and 2. CFL images in state 1 (A) and state 2 (B) cells as indicated by the color scale from 100 to 300 ps. (Scale bars, 10 μm.) (C) The photon count ratio of CFL250 ps/CFL170 ps (±SD, n = 11 cells) in state 1 (S1) and state 2 (S2) cells. (D) Time-lapse CFL images of WT cells during state 2 transitions as indicated by the color scale from 100 to 300 ps. (Scale bar, 10 μm.)
Fig. 2.
Fig. 2.
Quantitative measurements of the CFL shift observed during state 2 transitions in single WT (AC), stt7 (DF), and ΔPSI/II (GI) cells. The overall CFL distribution measured in single WT (A), stt7 (D), and ΔPSI/II (G) cells during the 5-min state 2 transition. The spatiotemporal distribution of the CFL shift observed in single WT (B), stt7 (E), and ΔPSI/II (H) cells during the same time course shown in A, D, and G, respectively. Colors indicate pixels whose strongest CFL was 170 ± 10 ps (blue) and 250 ± 10 ps (red). These colors are overlaid on the total fluorescence images indicated in gray scale. (Scale bars, 5 μm.) The change in the photon count for CFL170 ps (blue) and CFL250 ps (red) observed in single WT (C), stt7 (F), and ΔPSI/II (I) cells during the same time course shown in A, D, and G, respectively. Phosphorylation of major LHCII detected by immunoblot analysis using an anti-phosphothreonine antibody is shown under the photon count data.
Fig. 3.
Fig. 3.
Protein composition in the ΔPSI/II mutant. (A) Immunoblot analysis of thylakoid membranes isolated from WT and ΔPSI/II cells using antibodies specific for PSI (PsaA, PsaF), PSII (CP47, D1), cytochrome b6f complex (Cyt b6, Cyt f), minor LHCII (CP26, CP29), and major LHCII (LhcbM6). Protein samples were normalized to the amount of major LHCII. (B) Sucrose density gradient centrifugation to separate chlorophyll-protein complexes of thylakoid membranes isolated from ΔPSI/II. (C) SDS/PAGE analysis of the chlorophyll-protein complexes separated in the sucrose density gradient in B. The gel was stained with Coomassie brilliant blue R-250. Arrows and arrowheads indicate the protein bands for LHCII and LHCI, respectively.
Fig. 4.
Fig. 4.
Biochemical differences between LHCII and phospho-LHCII. (A) Thylakoid membranes isolated from WT cells in state 1 (S1) and state 2 (S2) were subjected to sucrose density gradient ultracentrifugation, which separated LHCII, PSII, and PSI-LHCI protein complexes. (B) Phosphorylated proteins in the LHCII fractions obtained in A are shown by immunoblot analysis using an anti-phosphothreonine antibody. Proteins were normalized with the amount of LHCII protein (α-LHCII). Electron micrographs of the negative-stained LHCII fractions in S1 (C) and S2 (D) obtained in A. (Scale bars, 50 nm.) Energy-dissipative state of phospho-LHCII are shown by mean CFL of LHCII fractions in state 1 (E) and state 2 (F) which were obtained in A. Color scale indicates mean CFL. (Scale bars, 5 μm.)
Fig. 5.
Fig. 5.
A model for the dissociation of phospho-LHCII from PSII during state 2 transitions. (A) Dissociation of phospho-LHCII (both major and minor LHCII) from PSII. (B) Aggregation of phospho-LHCII. (C) Migration of LHCII from aggregates to PSI-LHCI supercomplex. (D) Association of LHCII (both major and minor LHCII) with PSI-LHCI supercomplex. The reverse process occurs during the transition from state 2 to state 1 (D’A’). The crystal coordinates were obtained from the Protein Data Bank: PSII core dimer, 2AXT; LHCII, 2NHW; and PSI-LHCI supercomplex, 2O01.

Comment in

Similar articles

Cited by

References

    1. Murata N. Control of excitation transfer in photosynthesis. I. Light-induced change of chlorophyll a fluorescence in Porphyridium cruentum. Biochim Biophys Acta. 1969;172:242–251. - PubMed
    1. Bonaventura C, Myers J. Fluorescence and oxygen evolution from Chlorella pyrenoidosa. Biochim Biophys Acta. 1969;189:366–383. - PubMed
    1. Allen JF, Bennett J, Steinback KE, Arntzen CJ. Chloroplast protein phosphorylation couples plastoquinone redox state to distribution of excitation energy between photosystems. Nature. 1981;291:25–29.
    1. Wollman F-A, Lemaire C. Studies on kinase-controlled state transitions in photosystem II and b6 f mutants from Chlamydomonas reinhardtii which lack quinone-binding proteins. Biochim Biophys Acta. 1988;933:85–94.
    1. Bellafiore S, Barneche F, Peltier G, Rochaix J-D. State transitions and light adaptation require chloroplast thylakoid protein kinase STN7. Nature. 2005;433:892–895. - PubMed

Publication types

MeSH terms

LinkOut - more resources