

Metabolic remodeling of the human red blood cell membrane
- PMID: 20080583
- PMCID: PMC2802590
- DOI: 10.1073/pnas.0910785107
Metabolic remodeling of the human red blood cell membrane
Abstract
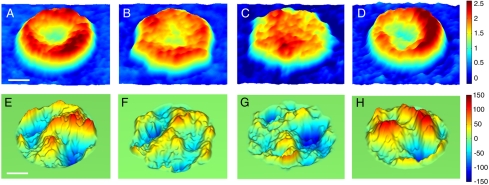
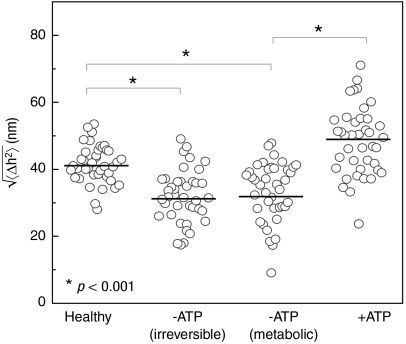
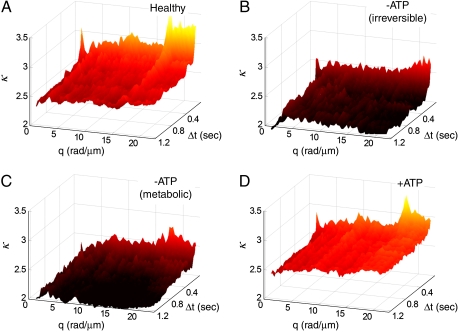
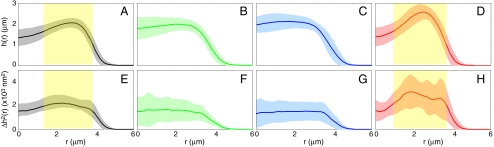
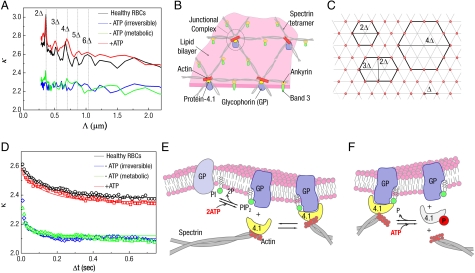
The remarkable deformability of the human red blood cell (RBC) results from the coupled dynamic response of the phospholipid bilayer and the spectrin molecular network. Here we present quantitative connections between spectrin morphology and membrane fluctuations of human RBCs by using dynamic full-field laser interferometry techniques. We present conclusive evidence that the presence of adenosine 5'-triphosphate (ATP) facilitates non-equilibrium dynamic fluctuations in the RBC membrane that are highly correlated with the biconcave shape of RBCs. Spatial analysis of the fluctuations reveals that these non-equilibrium membrane vibrations are enhanced at the scale of spectrin mesh size. Our results indicate that the dynamic remodeling of the coupled membranes powered by ATP results in non-equilibrium membrane fluctuations manifesting from both metabolic and thermal energies and also maintains the biconcave shape of RBCs.
Conflict of interest statement
The authors declare no conflict of interest.
Figures
Similar articles
-
Spatially-resolved eigenmode decomposition of red blood cells membrane fluctuations questions the role of ATP in flickering.PLoS One. 2012;7(8):e40667. doi: 10.1371/journal.pone.0040667. Epub 2012 Aug 10. PLoS One. 2012. PMID: 22899990 Free PMC article.
-
Myosin IIA interacts with the spectrin-actin membrane skeleton to control red blood cell membrane curvature and deformability.Proc Natl Acad Sci U S A. 2018 May 8;115(19):E4377-E4385. doi: 10.1073/pnas.1718285115. Epub 2018 Apr 2. Proc Natl Acad Sci U S A. 2018. PMID: 29610350 Free PMC article.
-
Membrane Remodelling and Vesicle Formation During Ageing of Human Red Blood Cells.Cell Physiol Biochem. 2017;42(3):1127-1138. doi: 10.1159/000478768. Epub 2017 Jun 30. Cell Physiol Biochem. 2017. PMID: 28668965
-
Dependence of spectrin organization in red blood cell membranes on cell metabolism: implications for control of red cell shape, deformability, and surface area.Semin Hematol. 1979 Jan;16(1):75-93. Semin Hematol. 1979. PMID: 154737 Review. No abstract available.
-
The Effect of Sepsis on the Erythrocyte.Int J Mol Sci. 2017 Sep 8;18(9):1932. doi: 10.3390/ijms18091932. Int J Mol Sci. 2017. PMID: 28885563 Free PMC article. Review.
Cited by
-
Stretching of red blood cells using an electro-optics trap.Biomed Opt Express. 2014 Dec 11;6(1):118-23. doi: 10.1364/BOE.6.000118. eCollection 2015 Jan 1. Biomed Opt Express. 2014. PMID: 25657880 Free PMC article.
-
Computational Biomechanics of Human Red Blood Cells in Hematological Disorders.J Biomech Eng. 2017 Feb 1;139(2):0210081-02100813. doi: 10.1115/1.4035120. J Biomech Eng. 2017. PMID: 27814430 Free PMC article. Review.
-
Probing cellular mechanics with acoustic force spectroscopy.Mol Biol Cell. 2018 Aug 8;29(16):2005-2011. doi: 10.1091/mbc.E18-03-0154. Epub 2018 Jun 21. Mol Biol Cell. 2018. PMID: 29927358 Free PMC article.
-
The Effects of Ethanol on the Morphological and Biochemical Properties of Individual Human Red Blood Cells.PLoS One. 2015 Dec 21;10(12):e0145327. doi: 10.1371/journal.pone.0145327. eCollection 2015. PLoS One. 2015. PMID: 26690915 Free PMC article.
-
Red blood cell flickering activity locally controlled by holographic optical tweezers.iScience. 2024 May 8;27(6):109915. doi: 10.1016/j.isci.2024.109915. eCollection 2024 Jun 21. iScience. 2024. PMID: 38832008 Free PMC article.
References
-
- Mohandas N, Evans E. Mechanical properties of the red cell membrane in relation to molecular structure and genetic defects. Ann Rev Bioph Biom. 1994;23(1):787–818. - PubMed
-
- Brochard F, Lennon JF. Frequency spectrum of the flicker phenomenon in erythrocytes. J Phys-Paris. 1975;36:1035–1047.
-
- Zilker A, Engelhardt H, Sackmann E. Dynamic reflection interference contrast (RIC-) microscopy: Anew method to study surface excitations of cells and to measure membrane bending elastic moduli. J Phys-Paris. 1987;48:2139–2151.
-
- Gov N, Zilman AG, Safran S. Cytoskeleton confinement and tension of red blood cell membranes. Phys Rev Lett. 2003;90(22):228101–228104. - PubMed
-
- Popescu G, et al. Optical measurement of cell membrane tension. Phys Rev Lett. 2006;97(21):218101–218104. - PubMed
Publication types
MeSH terms
Substances
Grants and funding
LinkOut - more resources
Full Text Sources
Other Literature Sources
