. 2010 Jan 26;107(4):1265-72.
doi: 10.1073/pnas.0913626107. Epub 2010 Jan 4.

Evolutionary diversification, coevolution between populations and their antagonists, and the filling of niche space

Affiliations

Evolutionary diversification, coevolution between populations and their antagonists, and the filling of niche space

Robert E Ricklefs. Proc Natl Acad Sci U S A. .

Abstract

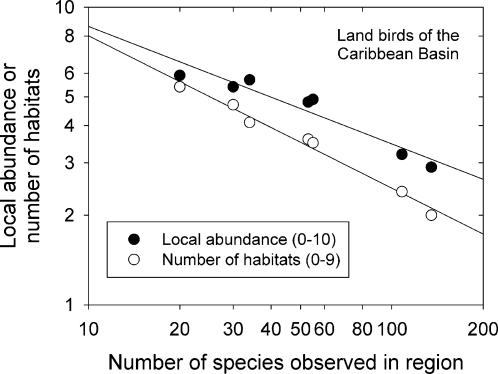
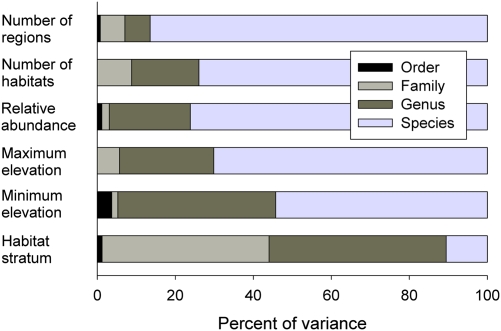
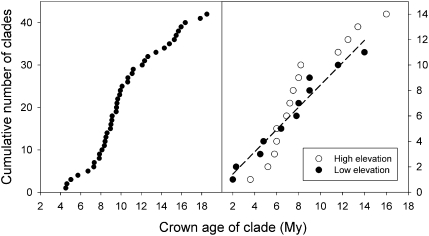
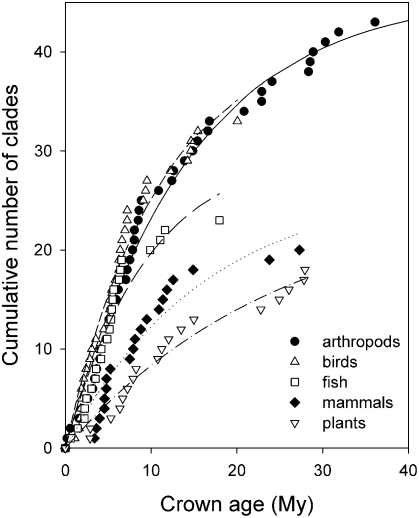
The population component of a species' niche corresponds to the distribution of individuals across environments within a region. As evolutionary clades of species diversify, they presumably fill niche space, and, consequently, the rate of increase in species numbers slows. Total niche space and species numbers appear to be relatively stable over long periods, and so an increase in the species richness of one clade must be balanced by decrease in others. However, in several analyses, the total population niche space occupied per clade is independent of the number of species, suggesting that species in more diverse clades overlap more in niche space. This overlap appears to be accommodated by variation in the populations of each species, including their absence, within suitable niche space. I suggest that the uneven filling of niche space results from localized outcomes of the dynamic coevolutionary interactions of populations with their pathogens or other antagonists. Furthermore, I speculate that relationships with pathogens might constrain diversification if pathogen diversity increased with host diversity and resulted in more frequent host switching and emergent disease. Many indirect observations are consistent with these scenarios. However, the postulated influence of pathogens on the filling of niche space and diversification of clades primarily highlights our lack of knowledge concerning the space and time dimensions of coevolutionary interactions and their influence on population distribution and species diversification.


Conflict of interest statement

The author declares no conflict of interest.

Figures

Fig. 1.
Fig. 1.
Decrease in local abundance and habitat breadth of species observed over nine matched habitats ranging from grassland to cloud forest on five islands in the West Indies and two continental areas (Trinidad and Panama) of the Caribbean Basin. [From Ricklefs (28) based on data in Cox and Ricklefs (29) and Wunderle (109).]
Fig. 2.
Fig. 2.
Taxonomically nested analysis of variance (order, family, genus, species) in measures of geographic range, habitat breadth, and relative abundance. Data refer to 3,033 species of nonraptorial land birds of South America and are from Stotz et al. (72), who reported the number of zoological regions (of 22) and number of forested (of 14) and open (of 14) habitats occupied by each species. Abundance was assigned to one of four ordinal categories (rare, fairly common, common, or abundant). Habitat stratum was assigned to one of five ordinal categories (ground, understory, midcanopy, canopy, or aerial).
Fig. 3.
Fig. 3.
(Left) Cumulative number of avian clades (•) compiled by Phillimore and Price (4) as a function of clade age. (Right) Cumulative number of primarily genus-level clades assembled by Weir (52) for high-elevation (○) and low elevation (• and regression line) South American land birds. The slope of the relationship between cumulative clades and time is the rate of clade origination in the respective samples.
Fig. 4.
Fig. 4.
Increase in the cumulative number of clades with increasing age in a sample assembled according to other criteria by McPeek and Brown (110) and McPeek (3). Estimated rates of extinction were arthropods, 0.070 ± 0.003; birds, 0.093 ± 0.010; fish, 0.105 ± 0.021; mammals, 0.062 ± 0.014; flowering plants (Magnoliaphyta), 0.040 ± 0.009.
Fig. 5.
Fig. 5.
Average abundances of species of trees within family-level taxa on the 50-ha forest dynamics plot on Barro Colorado Island, Panama, based on the average number of individuals for each of 250 species in six 5-year censuses. Families with the same number of species are separated slightly to show the standard deviations of abundance among species. (Data from https://ctfs.arnarb.harvard.edu/webatlas/datasets/bci/abundance/bciN100.html.) Neither the family mean abundance (F 1,54 = 0, P = 0.95) nor the SD of abundance within families (F 1,34 = 1.35, P = 0.25) was related to the number of species per family.
Fig. 6.
Fig. 6.
Abundances of three species of warbler (Parulinae) compared with predictions based on multiple regressions of their abundances on five Bray-Curtis ordination axes for 56 species of nonraptorial land birds recorded in 128 Breeding Bird Censuses from terrestrial habitats in North America.

Similar articles

Cited by

References

    1. Chase JM, Leibold MA. Ecological Niches. Linking Classical and Contemporary Approaches. Chicago: University of Chicago Press; 2003.
    1. Hutchinson GE. Concluding remarks. Cold Spring Harb Symp Quant Biol. 1957;22:415–427.
    1. McPeek MA. The ecological dynamics of clade diversification and community assembly. Am Nat. 2008;172:E270–E284. - PubMed
    1. Phillimore AB, Price TD. Density-dependent cladogenesis in birds. PLoS Biol. 2008;6:e71. - PMC - PubMed
    1. Simpson GG. The Major Features of Evolution. New York: Columbia University Press; 1953.

Publication types