

Effect of hydrogen bond cooperativity on the behavior of water
- PMID: 20080604
- PMCID: PMC2824356
- DOI: 10.1073/pnas.0912756107
Effect of hydrogen bond cooperativity on the behavior of water
Abstract
Four scenarios have been proposed for the low-temperature phase behavior of liquid water, each predicting different thermodynamics. The physical mechanism that leads to each is debated. Moreover, it is still unclear which of the scenarios best describes water, because there is no definitive experimental test. Here we address both open issues within the framework of a microscopic cell model by performing a study combining mean-field calculations and Monte Carlo simulations. We show that a common physical mechanism underlies each of the four scenarios, and that two key physical quantities determine which of the four scenarios describes water: (i) the strength of the directional component of the hydrogen bond and (ii) the strength of the cooperative component of the hydrogen bond. The four scenarios may be mapped in the space of these two quantities. We argue that our conclusions are model independent. Using estimates from experimental data for H-bond properties the model predicts that the low-temperature phase diagram of water exhibits a liquid-liquid critical point at positive pressure.
Conflict of interest statement
The authors declare no conflict of interest.
Figures
 ), fixed H-bond volume increase (v
HB/v
0 = 0.5), and different values of the H-bond cooperativity strength
), fixed H-bond volume increase (v
HB/v
0 = 0.5), and different values of the H-bond cooperativity strength  . (A) Singularity-free scenario (
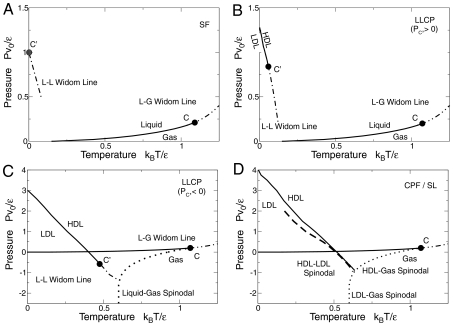
 ). At high T, liquid (L) and gas (G) phases are separated by a first order transition line (thick line) ending at a critical point C, from which a L–G Widom line (double-dot-dashed line) emanates. In the liquid phase, maxima of K
T and |α
P| converge to a locus (dot-dashed line). At C
′ both K
T and |α
P| have diverging maxima. The locus of the maxima is related to the L–L Widom line for T
C′ → 0 (see text). (B) LLCP scenario with positive critical pressure (for
). At high T, liquid (L) and gas (G) phases are separated by a first order transition line (thick line) ending at a critical point C, from which a L–G Widom line (double-dot-dashed line) emanates. In the liquid phase, maxima of K
T and |α
P| converge to a locus (dot-dashed line). At C
′ both K
T and |α
P| have diverging maxima. The locus of the maxima is related to the L–L Widom line for T
C′ → 0 (see text). (B) LLCP scenario with positive critical pressure (for  ). At low T and high P, a HDL and a LDL are separated by a first order transition line (thick line with HDL/LDL labeled) ending in a critical point C
′, from which the L–L Widom line (dot-dashed line) emanates. Other symbols are as in the previous panel. (C) LLCP scenario with negative critical pressure (for
). At low T and high P, a HDL and a LDL are separated by a first order transition line (thick line with HDL/LDL labeled) ending in a critical point C
′, from which the L–L Widom line (dot-dashed line) emanates. Other symbols are as in the previous panel. (C) LLCP scenario with negative critical pressure (for  ). Here the L–L Widom line (dot-dashed line) is shown intersecting the L–G spinodal (dotted line). Other symbols are as in the previous panel. (D) Critical-point free scenario (
 ). The HDL–LDL coexistence line extends to the superheated liquid region at P < 0, reaching with the liquid spinodal (dotted line). The stability limit (SL) of water at ambient conditions (HDL) is delimited by the superheated L–G spinodal and the supercooled HDL–LDL spinodal (dashed line), giving a reentrant behavior as hypothesized in the SL scenario. Other symbols are as in the previous panels. In all panels, k
B is the Boltzmann constant.
). The HDL–LDL coexistence line extends to the superheated liquid region at P < 0, reaching with the liquid spinodal (dotted line). The stability limit (SL) of water at ambient conditions (HDL) is delimited by the superheated L–G spinodal and the supercooled HDL–LDL spinodal (dashed line), giving a reentrant behavior as hypothesized in the SL scenario. Other symbols are as in the previous panels. In all panels, k
B is the Boltzmann constant.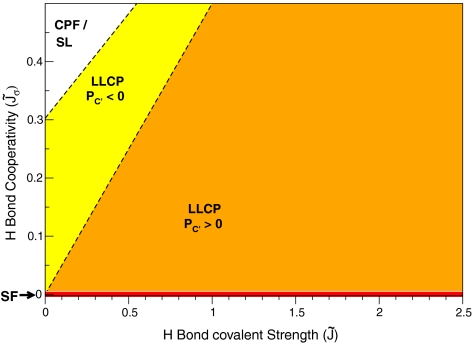
 (covalent or directional component) and
  (cooperative or three-body component), both in units of the van der Waals energy ϵ, were obtained from MF calculations. The ratio v
HB/v
0 is kept constant. (i) If
(cooperative or three-body component), both in units of the van der Waals energy ϵ, were obtained from MF calculations. The ratio v
HB/v
0 is kept constant. (i) If  (red line along x-axis), the SF scenario is realized independent of
  . (ii) For large enough
  , water would possess a first-order L–L phase transition line terminating at the L–G spinodal—the CPF scenario; the liquid spinodal would retrace at negative pressure, as in the SL scenario (white region in top left). (iii) For other combinations of
  and
and  , water would be described by the LLCP scenario. For larger
  , the LLCP is at negative pressure (yellow region between dashed lines). For smaller
  , the LLCP is at positive pressure (orange region in bottom right). Dashed lines separating the three different regions correspond to MF results of the microscopic cell model. Equations for the lines are
  and
and  , with a ≃ 0.3 and b ≃ 0.36. The P - T phase diagram evolves continuously as
  and
and  change.
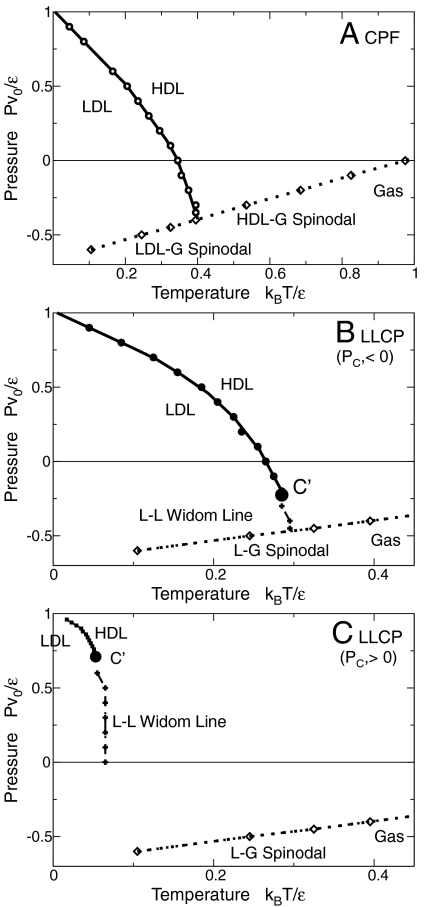
 , v
HB/v
0 = 0.5 and vary the parameter
, v
HB/v
0 = 0.5 and vary the parameter  . (A) For
  (i.e.,
  where a and b are given in the text and both are approximately 1/3), we find a L–L phase transition (thick line with circles) ending on the superheated L–G spinodal (dotted line with diamonds) as in the CPF scenario. (B) For
  (i.e.,
  ), the L–L phase transition ends in a LLCP at negative pressure. (C) For
  (i.e.,
  ), the LLCP ends at positive pressure and the line of specific heat maxima (crosses), emanating from the LLCP and approximating the L–L Widom line, is shown only for positive pressure. In all the phase diagrams, P and T are expressed in internal units and can be converted to real units through the choice of physical values for the parameters ϵ and v
0 and shifting the resulting phase diagram in accord with an experimental reference point. Errors are of the order of the symbol sizes. Lines are guides for the eyes. Other model parameters are as for MF calculations (see text).
), the LLCP ends at positive pressure and the line of specific heat maxima (crosses), emanating from the LLCP and approximating the L–L Widom line, is shown only for positive pressure. In all the phase diagrams, P and T are expressed in internal units and can be converted to real units through the choice of physical values for the parameters ϵ and v
0 and shifting the resulting phase diagram in accord with an experimental reference point. Errors are of the order of the symbol sizes. Lines are guides for the eyes. Other model parameters are as for MF calculations (see text).References
-
- Zheligovskaya EA, Malenkov GG. Crystalline water ices. Russ Chem Rev. 2006;75:57–76.
-
- Debenedetti PG. Supercooled and glassy water. J Phys Condens Matter. 2003;15:R1669–R1726.
-
- Loerting T, Giovambattista N. Amorphous ice: Experiments and numerical simulation. J Phys Condens Matter. 2006;18:R919–R977.
-
- Stanley HE, Teixeira J, Geiger A, Blumberg RL. Interpretation of the unusual behavior of H 20 and D 2 O at low temperature: Are concepts of percolation relevant to the puzzle of liquid water? Physica A . 1981;106:260–277.
LinkOut - more resources
Full Text Sources
