

Inhibition of the K+ channel KCa3.1 ameliorates T cell-mediated colitis
- PMID: 20080610
- PMCID: PMC2824388
- DOI: 10.1073/pnas.0910133107
Inhibition of the K+ channel KCa3.1 ameliorates T cell-mediated colitis
Abstract
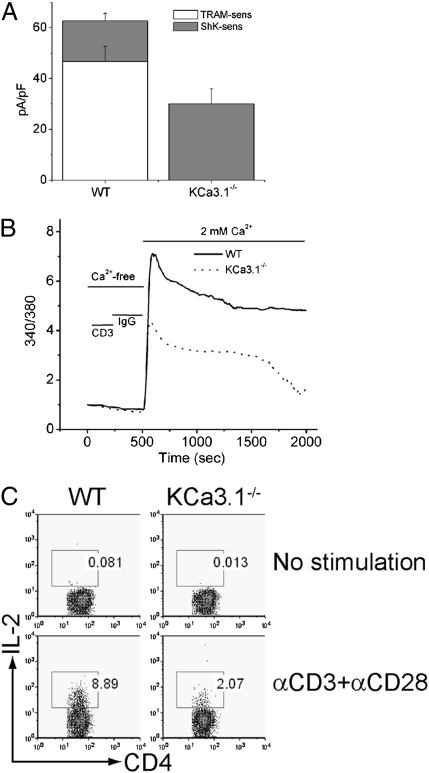
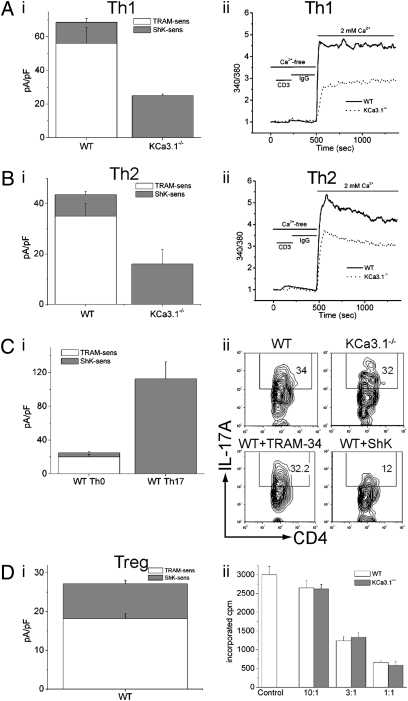
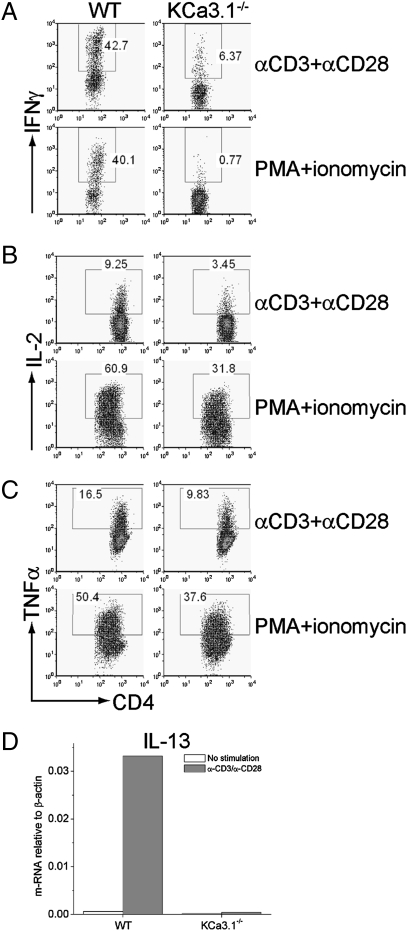
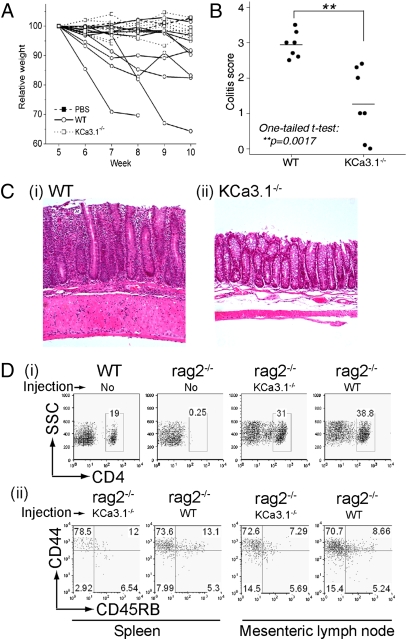
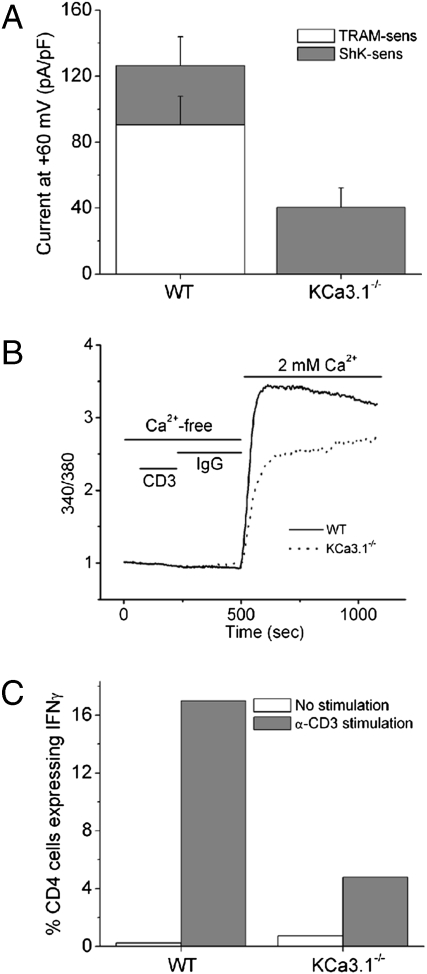
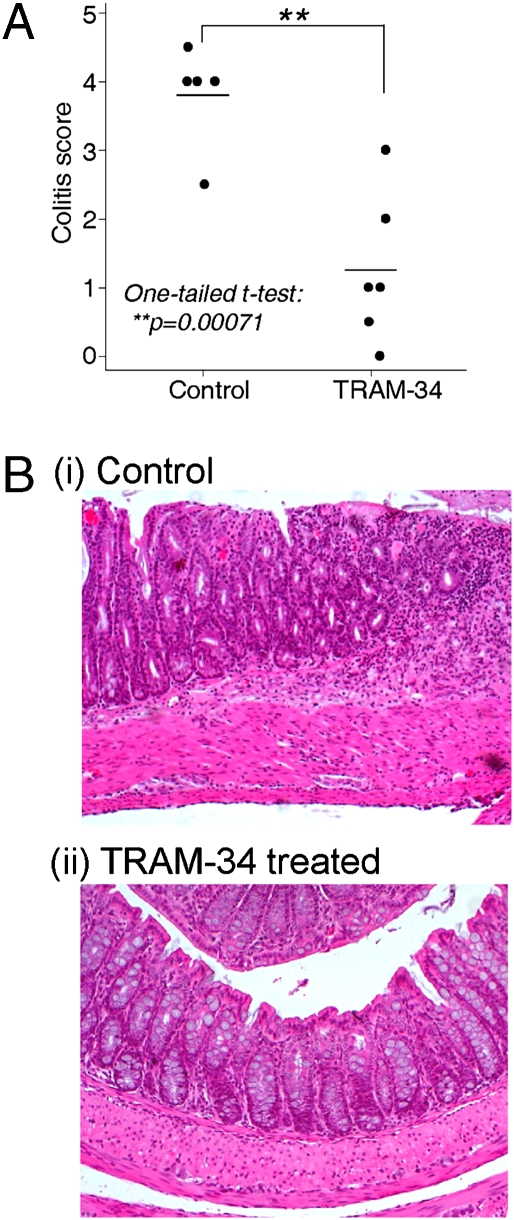
The calcium-activated K(+) channel KCa3.1 plays an important role in T lymphocyte Ca(2+) signaling by helping to maintain a negative membrane potential, which provides an electrochemical gradient to drive Ca(2+) influx. To assess the role of KCa3.1 channels in lymphocyte activation in vivo, we studied T cell function in KCa3.1(-/-) mice. CD4 T helper (i.e., Th0) cells isolated from KCa3.1(-/-) mice lacked KCa3.1 channel activity, which resulted in decreased T cell receptor-stimulated Ca(2+) influx and IL-2 production. Although loss of KCa3.1 did not interfere with CD4 T cell differentiation, both Ca(2+) influx and cytokine production were impaired in KCa3.1(-/-) Th1 and Th2 CD4 T cells, whereas T-regulatory and Th17 function were normal. We found that inhibition of KCa3.1(-/-) protected mice from developing severe colitis in two mouse models of inflammatory bowel disease, which were induced by (i) the adoptive transfer of mouse naïve CD4 T cells into rag2(-/-) recipients and (ii) trinitrobenzene sulfonic acid. Pharmacologic inhibitors of KCa3.1 have already been shown to be safe in humans. Thus, if these preclinical studies continue to show efficacy, it may be possible to rapidly test whether KCa3.1 inhibitors are efficacious in patients with inflammatory bowel diseases such as Crohn's disease and ulcerative colitis.
Conflict of interest statement
The authors declare no conflict of interest.
Figures
Similar articles
-
Upregulation of KCa3.1 K(+) channel in mesenteric lymph node CD4(+) T lymphocytes from a mouse model of dextran sodium sulfate-induced inflammatory bowel disease.Am J Physiol Gastrointest Liver Physiol. 2014 May 15;306(10):G873-85. doi: 10.1152/ajpgi.00156.2013. Epub 2014 Mar 27. Am J Physiol Gastrointest Liver Physiol. 2014. PMID: 24674776
-
Histone Deacetylases Enhance Ca2+-Activated K⁺ Channel KCa3.1 Expression in Murine Inflammatory CD4⁺ T Cells.Int J Mol Sci. 2018 Sep 27;19(10):2942. doi: 10.3390/ijms19102942. Int J Mol Sci. 2018. PMID: 30262728 Free PMC article.
-
Protein histidine phosphatase 1 negatively regulates CD4 T cells by inhibiting the K+ channel KCa3.1.Proc Natl Acad Sci U S A. 2008 Sep 23;105(38):14442-6. doi: 10.1073/pnas.0803678105. Epub 2008 Sep 16. Proc Natl Acad Sci U S A. 2008. PMID: 18796614 Free PMC article.
-
The role of T cell potassium channels, KV1.3 and KCa3.1, in the inflammatory cascade in ulcerative colitis.Dan Med J. 2014 Nov;61(11):B4946. Dan Med J. 2014. PMID: 25370966 Review.
-
Ca2+-Activated K+ Channel KCa3.1 as a Therapeutic Target for Immune Disorders.Biol Pharm Bull. 2018;41(8):1158-1163. doi: 10.1248/bpb.b18-00078. Biol Pharm Bull. 2018. PMID: 30068864 Review.
Cited by
-
Differential DNA methylation and mRNA transcription in gingival tissues in periodontal health and disease.J Clin Periodontol. 2021 Sep;48(9):1152-1164. doi: 10.1111/jcpe.13504. Epub 2021 Jul 11. J Clin Periodontol. 2021. PMID: 34101221 Free PMC article.
-
Ion channel regulation of gut immunity.J Gen Physiol. 2023 Feb 6;155(2):e202113042. doi: 10.1085/jgp.202113042. Epub 2022 Dec 2. J Gen Physiol. 2023. PMID: 36459135 Free PMC article.
-
Reduction of Ca2+ Entry by a Specific Block of KCa3.1 Channels Optimizes Cytotoxic Activity of NK Cells against T-ALL Jurkat Cells.Cells. 2023 Aug 15;12(16):2065. doi: 10.3390/cells12162065. Cells. 2023. PMID: 37626875 Free PMC article.
-
The Ca²⁺-activated K⁺ channel KCa3.1 as a potential new target for the prevention of allograft vasculopathy.PLoS One. 2013 Nov 29;8(11):e81006. doi: 10.1371/journal.pone.0081006. eCollection 2013. PLoS One. 2013. PMID: 24312257 Free PMC article.
-
Divalent cation signaling in immune cells.Trends Immunol. 2014 Jul;35(7):332-44. doi: 10.1016/j.it.2014.05.001. Epub 2014 Jun 2. Trends Immunol. 2014. PMID: 24932518 Free PMC article. Review.
References
-
- Feske S. Calcium signalling in lymphocyte activation and disease. Nat Rev Immunol. 2007;7:690–702. - PubMed
-
- Luik RM, Lewis RS. New insights into the molecular mechanisms of store-operated Ca2+ signaling in T cells. Trends Mol Med. 2007;13:103–107. - PubMed
-
- Crabtree GR, Olson EN. NFAT signaling: choreographing the social lives of cells. Cell. 2002;109(Suppl):S67–S79. - PubMed
-
- Winslow MM, Crabtree GR. Immunology. Decoding calcium signaling. Science. 2005;307:56–57. - PubMed
-
- Wulff H, Beeton C, Chandy KG. Potassium channels as therapeutic targets for autoimmune disorders. Curr Opin Drug Discov Devel. 2003;6:640–647. - PubMed
Publication types
MeSH terms
Substances
Grants and funding
LinkOut - more resources
Full Text Sources
Other Literature Sources
Molecular Biology Databases
Research Materials
Miscellaneous
