. 2010 Jan 19;107(3):1130-5.
doi: 10.1073/pnas.0903907107. Epub 2010 Jan 4.

Ras membrane orientation and nanodomain localization generate isoform diversity

Affiliations

Ras membrane orientation and nanodomain localization generate isoform diversity

Daniel Abankwa et al. Proc Natl Acad Sci U S A. .

Abstract

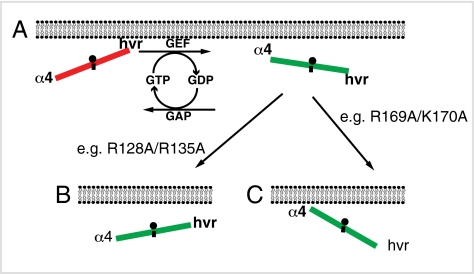
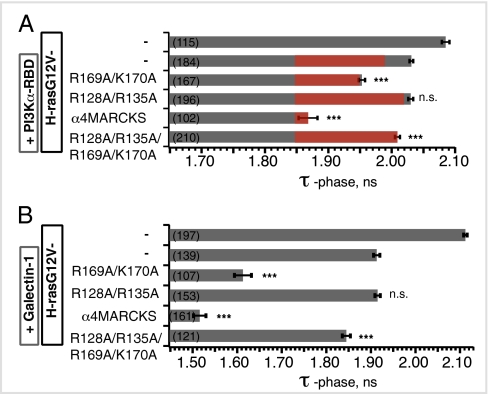
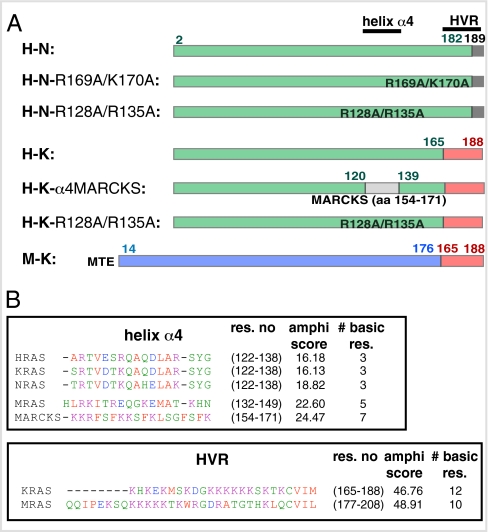
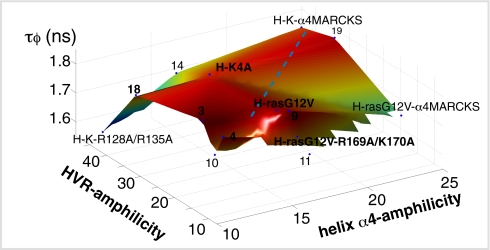
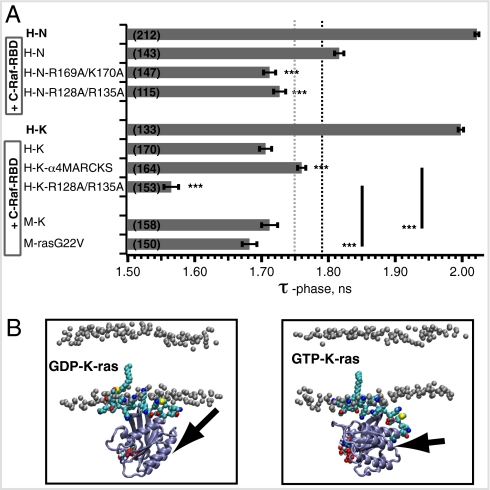
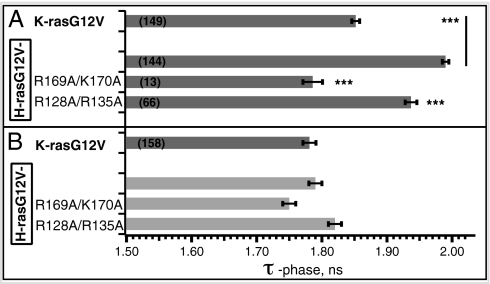
The structural elements encoding functional diversity among Ras GTPases are poorly defined. The orientation of the G domain of H-ras with respect to the plane of the plasma membrane is recognized by the Ras binding domain of C-Raf, coupling orientation to MAPK activation. We now show that two other proteins, phosphoinositide-3-kinase-alpha and the structurally unrelated galectin-1, also recognize G-domain orientation. These results rationalize the role of galectin-1 in generating active GTP-H-ras signaling nanoclusters. However, molecular dynamics simulations of K-ras membrane insertion and fluorescence lifetime imaging microscopy (FLIM)-Förster resonance energy transfer (FRET) imaging of the effector interactions of N-Ras, K-Ras, and M-ras suggest that there are two hyperactive, signaling-competent orientations of the Ras G domain. Mutational and functional analyses establish a clear relationship between effector binding and the amphilicities of helix alpha4 and the C-terminal hypervariable region, thus confirming that these structural elements critically tune the orientation of the Ras G domain. Finally, we show that G-domain orientation and nanoclustering synergize to generate Ras isoform specificity with respect to effector interactions.


Conflict of interest statement

The authors declare no conflict of interest.

Figures

Fig. 1.
Fig. 1.
The balance model explains G-domain orientation-activity relationships. (A) The balance model shows how orientation of the Ras G domain with respect to the plasma membrane is controlled by the switched elements, helix α4 and the HVR, and how orientation correlates with activity. A conformational equilibrium between the two orientations is assumed based on computational simulations (19). The steepness of the balance signifies the probability of finding Ras in that orientation. The equilibrium is regulated by the activation state and mediated by the specific residues of the switched elements. Mutation of the switched elements shifts the probability of the G domain assuming a given orientation. In H-ras, for example, (B) the mutation R128A/R135A in helix α4 shifts the balance toward stabilization by the HVR, whereas (C) mutation R169A/K170A in the HVR shifts the balance toward stabilization by helix α4.
Fig. 2.
Fig. 2.
Recognition of H-ras membrane orientation by PI3Kα-RBD and galectin-1. (A) BHK cells transiently coexpressing the indicated mGFP-H-rasG12V mutants and an excess of mRFP-PI3Kα-RBD (PI3Kα-RBD) or (B) mRFP-galectin-1 (galectin-1) at comparable levels were analyzed using FLIM-FRET. For comparison, the profile of the interaction with mRFP-C-Raf-RBD from our previous publication (21) is shown as a red overlay in A. Mean mGFP fluorescence lifetimes (τϕ ± SEM) were determined from four independent experiments. The number of cells analyzed is given in brackets. On coexpression of mRFP-PI3Kα-RBD or mRFP-galectin-1, all mGFP fluorescence lifetimes were significantly reduced, consistent with binding of PI3Kα-RBD or galectin-1 to Ras. Statistically significant changes in the fluorescence lifetimes of mGFP-H-rasG12V mutants compared with mGFP-H-rasG12V are shown (***P < 0.001; ns, not significant; two-tailed Student’s t test).
Fig. 3.
Fig. 3.
Properties of K-ras, M-ras, and N-ras chimeras. (A) The G domains of H-ras, N-ras, and K-ras are 90–100% conserved, and we, therefore, facilitated construction of switched element mutants in N-ras and K-ras by generating chimeras with existing H-ras mutants (21). This also ensured that the interaction surface between Ras and the RBD and the whole G domain were identical, allowing ready comparison among different datasets (see Fig. 5). To this end, we replaced the HVR of various H-ras mutants with the HVR of N-ras or K-ras4B to generate H-N and H-K chimeras, respectively. In the M-K chimera, the HVR of M-ras was replaced with that of K-ras4B. (B) The upper figure shows a ClustalW sequence alignment of residues on helix α4 of the Ras isoforms and the polybasic membrane anchor of the MARCKS protein. Sequences from H-ras, K-ras, and N-ras are nearly identical but diverge from M-ras and the MARCKS sequence. These relationships also translate into different amphilicity scores, which are calculated using the Bio3D package developed by Grant et al. (41) (http://mccammon.ucsd.edu/∼bgrant/bio3d/). The lower figure shows the similarity of the HVRs of K-ras and M-ras in terms of amphilicity scores and numbers of basic residues.
Fig. 5.
Fig. 5.
Plotting the balance model. A surface plot of the dependence of the fluorescence lifetime of H-Ras-chimera/C-Raf-RBD FRET pairs on calculated helix α4- and HVR-amphilicities is based on data given in the table in Fig. S4B. The plot was generated in MATLAB using a linear interpolation for surface calculation. Increasing mGFP-Ras fluorescence lifetimes are plotted color coded from violet to red with a rainbow look-up table. The dashed blue line indicates the approximate ridge region where the G-domain balance is equilibrated. The identities of selected Ras proteins are given next to their data point (blue dot). Numbers refer to the table in Fig. S4B. Please refer to Results and Discussion for more information.
Fig. 4.
Fig. 4.
Different switched elements in K-ras, N-ras, and M-ras affect the interaction probability with C-Raf-RBD. (A) Interaction profiles of mGFP-Ras and mRFP-C-Raf-RBD assayed using FLIM-FRET in BHK cells. Average mGFP fluorescence lifetimes (τϕ ± SEM) were determined from four independent experiments. The number of cells analyzed is given in brackets. The donor-only lifetimes of H-N and H-K shown are averages of donor-only lifetimes of all cognate mutants. Donor lifetimes of individual constructs are given in Fig. S3B. Average fluorescence lifetimes of donor-only samples of M-K (τϕ = 2.083 ± 0.008) and M-rasG22V (τϕ = 2.033 ± 0.005) were comparable. For comparison with our previous data (21), corresponding lifetimes of H-rasG12V (black dashed) and the hyperactive mutant H-rasG12V-R169A/K170A (light gray dashed) are shown. Qualitatively identical results were obtained with corresponding mutants of full-length N-ras and K-ras4B (Fig. S3D). On coexpression of mRFP-C-Raf-RBD, all mGFP fluorescence lifetimes were significantly reduced compared with the donor-only samples, which is consistent with RBD binding to Ras. Statistically significant changes of the mGFP lifetimes of each mutant from the nonmutated H-N/ or H-K/ RBD FRET pairs are indicated (***P < 0.001; 2-tailed Student’s t test). (B) Snapshots of GDP- (Left) or GTP-loaded (Right) K-ras were inserted into a DMPC bilayer and were obtained by molecular-dynamics simulations (30 ns and 31.5 ns, respectively). Note that in K-ras, helix α4 (arrow) does not stably contact the membrane in contrast with GTP-H-ras (19).
Fig. 6.
Fig. 6.
The CRD of C-Raf modulates Ras binding of the RBD. (A) Interaction of mGFP-tagged RasG12V mutants with mRFP-C-Raf-RBD-CRD in BHK cells was determined by FLIM-FRET. Data are averages from four independent experiments (τϕ ± SEM). All lifetimes are significantly lower than the donor-only lifetimes. Indicated significant differences are compared with H-rasG12V/ C-Raf-RBD-CRD or as indicated (***P < 0.001; 2-tailed Student's t test). (B) For comparison, interaction data of mRFP-C-Raf-RBD (i.e., without the CRD domain) with K-rasG12V and the H-rasG12V mutants is shown (in gray) (21). Addition of the CRD significantly increases fluorescence lifetimes of Ras-mutant FRET-pairs, except for mutant H-rasG12V-R169A/K170A (P = 0.2; t test). Note that this increase is significantly higher for H-rasG12V than for K-rasG12V, which translates into a higher selectivity for K-ras that is mediated by the addition of the CRD.

Similar articles

Cited by

References

    1. Wennerberg K, Rossman KL, Der CJ. The Ras superfamily at a glance. J Cell Sci. 2005;118:843–846. - PubMed
    1. Vetter IR, Wittinghofer A. The guanine nucleotide-binding switch in three dimensions. Science. 2001;294:1299–1304. - PubMed
    1. Sprang SR. G protein mechanisms: Insights from structural analysis. Annu Rev Biochem. 1997;66:639–678. - PubMed
    1. Herrmann C. Ras-effector interactions: After one decade. Curr Opin Struct Biol. 2003;13:122–129. - PubMed
    1. Herrmann C, Nassar N. Ras and its effectors. Prog Biophys Mol Biol. 1996;66:1–41. - PubMed

Publication types

MeSH terms