

RBBP9: a tumor-associated serine hydrolase activity required for pancreatic neoplasia
- PMID: 20080647
- PMCID: PMC2836678
- DOI: 10.1073/pnas.0911646107
RBBP9: a tumor-associated serine hydrolase activity required for pancreatic neoplasia
Abstract
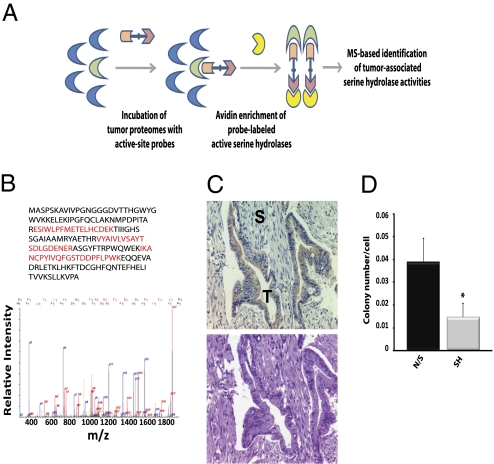
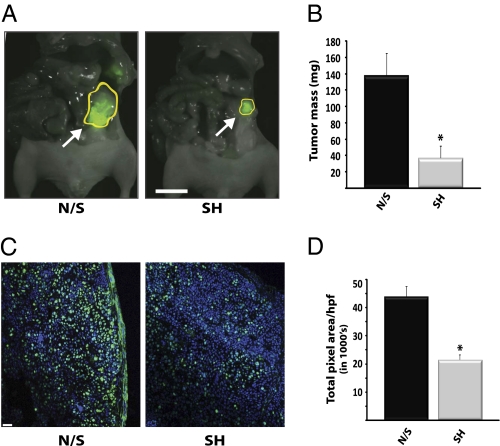
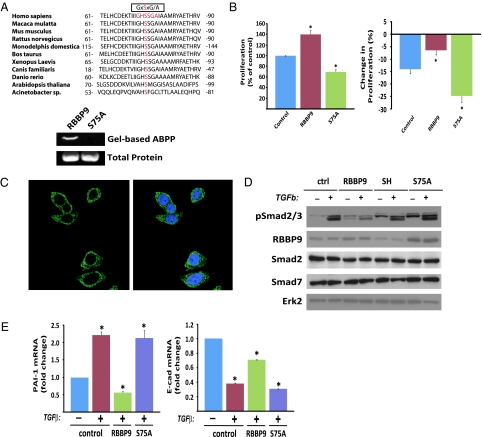
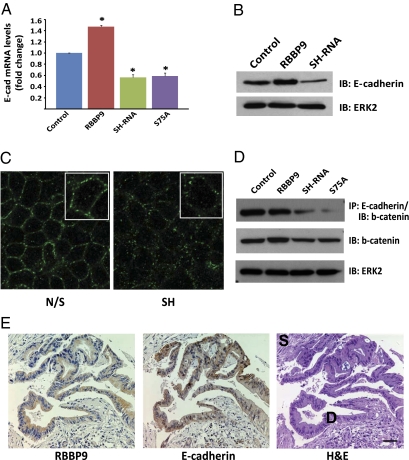
Pancreatic cancer is one of the most lethal malignancies. To discover functionally relevant modulators of pancreatic neoplasia, we performed activity-based proteomic profiling on primary human ductal adenocarcinomas. Here, we identify retinoblastoma-binding protein 9 (RBBP9) as a tumor-associated serine hydrolase that displays elevated activity in pancreatic carcinomas. Whereas RBBP9 is expressed in normal and malignant tissues at similar levels, its elevated activity in tumor cells promotes anchorage-independent growth in vitro as well as pancreatic carcinogenesis in vivo. At the molecular level, RBBP9 activity overcomes TGF-beta-mediated antiproliferative signaling by reducing Smad2/3 phosphorylation, a previously unknown role for a serine hydrolase in cancer biology. Conversely, loss of endogenous RBBP9 or expression of mutationally inactive RBBP9 leads to elevated Smad2/3 phosphorylation, implicating this serine hydrolase as an essential suppressor of TGF-beta signaling. Finally, RBBP9-mediated suppression of TGF-beta signaling is required for E-cadherin expression as loss of the serine hydrolase activity leads to a reduction in E-cadherin levels and a concomitant decrease in the integrity of tumor cell-cell junctions. These data not only define a previously uncharacterized serine hydrolase activity associated with epithelial neoplasia, but also demonstrate the potential benefit of functional proteomics in the identification of new therapeutic targets.
Conflict of interest statement
The authors declare no conflict of interest.
Figures
Comment in
-
Finding enzymes that are actively involved in cancer.Proc Natl Acad Sci U S A. 2010 Feb 9;107(6):2379-80. doi: 10.1073/pnas.0914955107. Epub 2010 Feb 1. Proc Natl Acad Sci U S A. 2010. PMID: 20133631 Free PMC article. No abstract available.
Similar articles
-
Finding enzymes that are actively involved in cancer.Proc Natl Acad Sci U S A. 2010 Feb 9;107(6):2379-80. doi: 10.1073/pnas.0914955107. Epub 2010 Feb 1. Proc Natl Acad Sci U S A. 2010. PMID: 20133631 Free PMC article. No abstract available.
-
Human retinoblastoma binding protein 9, a serine hydrolase implicated in pancreatic cancers.Protein Pept Lett. 2012 Feb;19(2):194-7. doi: 10.2174/092986612799080356. Protein Pept Lett. 2012. PMID: 21933118 Free PMC article. Review.
-
MicroRNA-323-3p inhibits cell invasion and metastasis in pancreatic ductal adenocarcinoma via direct suppression of SMAD2 and SMAD3.Oncotarget. 2016 Mar 22;7(12):14912-24. doi: 10.18632/oncotarget.7482. Oncotarget. 2016. PMID: 26908446 Free PMC article.
-
Targeting endogenous transforming growth factor beta receptor signaling in SMAD4-deficient human pancreatic carcinoma cells inhibits their invasive phenotype1.Cancer Res. 2004 Aug 1;64(15):5200-11. doi: 10.1158/0008-5472.CAN-04-0018. Cancer Res. 2004. PMID: 15289325
-
Smad anchor for receptor activation (SARA) in TGF-beta signaling.Front Biosci (Elite Ed). 2010 Jun 1;2(3):857-60. doi: 10.2741/e147. Front Biosci (Elite Ed). 2010. PMID: 20515759 Review.
Cited by
-
Oxime esters as selective, covalent inhibitors of the serine hydrolase retinoblastoma-binding protein 9 (RBBP9).Bioorg Med Chem Lett. 2010 Apr 1;20(7):2254-8. doi: 10.1016/j.bmcl.2010.02.011. Epub 2010 Feb 6. Bioorg Med Chem Lett. 2010. PMID: 20207142 Free PMC article.
-
Proteomic identification of RhoA as a potential biomarker for proliferation and metastasis in hepatocellular carcinoma.J Mol Med (Berl). 2011 Aug;89(8):817-27. doi: 10.1007/s00109-011-0753-3. Epub 2011 Apr 8. J Mol Med (Berl). 2011. PMID: 21475975
-
Mass spectrometry-based proteomics: qualitative identification to activity-based protein profiling.Wiley Interdiscip Rev Syst Biol Med. 2012 Mar-Apr;4(2):141-62. doi: 10.1002/wsbm.166. Epub 2012 Jan 9. Wiley Interdiscip Rev Syst Biol Med. 2012. PMID: 22231900 Free PMC article. Review.
-
Chemical approaches to study metabolic networks.Pflugers Arch. 2013 Mar;465(3):427-40. doi: 10.1007/s00424-012-1201-0. Epub 2013 Jan 8. Pflugers Arch. 2013. PMID: 23296751 Free PMC article. Review.
-
Exploring metabolic pathways and regulation through functional chemoproteomic and metabolomic platforms.Chem Biol. 2014 Sep 18;21(9):1171-84. doi: 10.1016/j.chembiol.2014.07.007. Chem Biol. 2014. PMID: 25237861 Free PMC article. Review.
References
-
- Chiang KP, Niessen S, Saghatelian A, Cravatt BF. An enzyme that regulates ether lipid signaling pathways in cancer annotated by multidimensional profiling. Chem Biol. 2006;13:1041–1050. - PubMed
-
- Madsen MA, Deryugina EI, Niessen S, Cravatt BF, Quigley JP. Activity-based protein profiling implicates urokinase activation as a key step in human fibrosarcoma intravasation. J Biol Chem. 2006;281:15997–16005. - PubMed
-
- Jessani N, et al. A streamlined platform for high-content functional proteomics of primary human specimens. Nat Methods. 2005;2:691–697. - PubMed
Publication types
MeSH terms
Substances
Grants and funding
LinkOut - more resources
Full Text Sources
Other Literature Sources
Medical
Molecular Biology Databases
