. 2010 Jan 26;107(4):1654-9.
doi: 10.1073/pnas.0908735107. Epub 2010 Jan 4.

The alpha2delta subunits of voltage-gated calcium channels form GPI-anchored proteins, a posttranslational modification essential for function

Affiliations

The alpha2delta subunits of voltage-gated calcium channels form GPI-anchored proteins, a posttranslational modification essential for function

Anthony Davies et al. Proc Natl Acad Sci U S A. .

Abstract

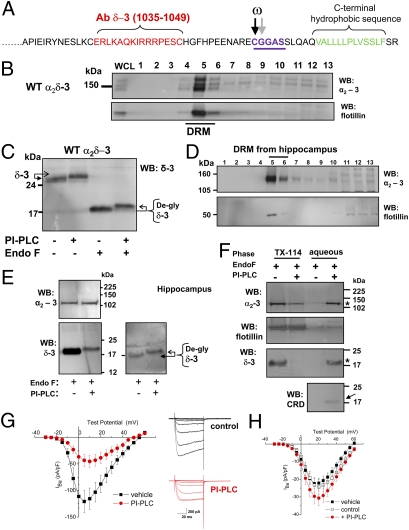
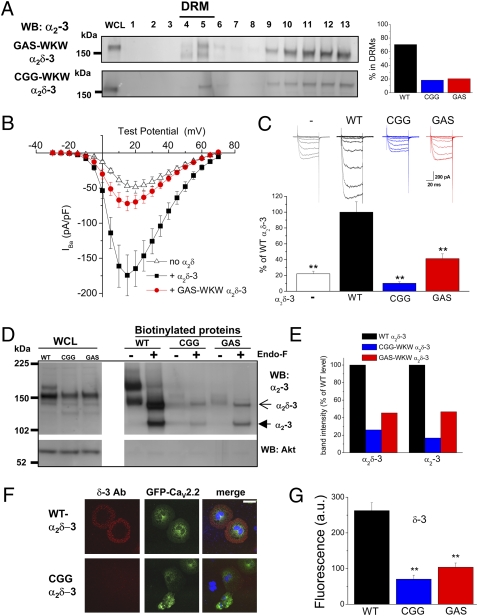
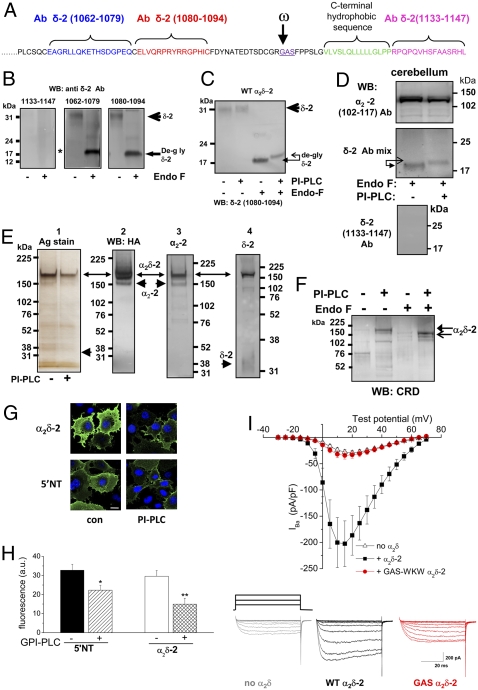
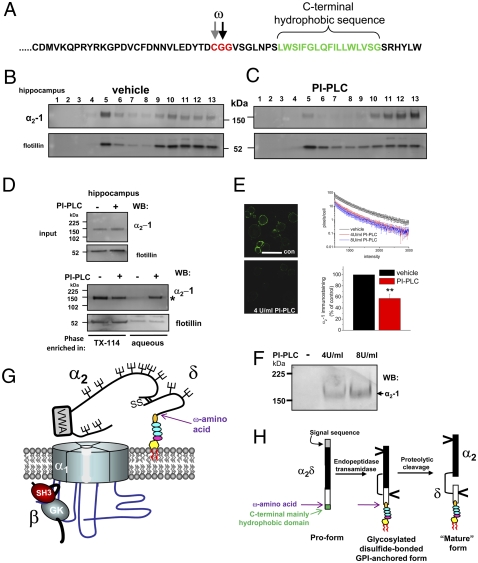
Voltage-gated calcium channels are thought to exist in the plasma membrane as heteromeric proteins, in which the alpha1 subunit is associated with two auxiliary subunits, the intracellular beta subunit and the alpha(2)delta subunit; both of these subunits influence the trafficking and properties of Ca(V)1 and Ca(V)2 channels. The alpha(2)delta subunits have been described as type I transmembrane proteins, because they have an N-terminal signal peptide and a C-terminal hydrophobic and potentially transmembrane region. However, because they have very short C-terminal cytoplasmic domains, we hypothesized that the alpha(2)delta proteins might be associated with the plasma membrane through a glycosylphosphatidylinositol (GPI) anchor attached to delta rather than a transmembrane domain. Here, we provide biochemical, immunocytochemical, and mutational evidence to show that all of the alpha(2)delta subunits studied, alpha(2)delta-1, alpha(2)delta-2, and alpha(2)delta-3, show all of the properties expected of GPI-anchored proteins, both when heterologously expressed and in native tissues. They are substrates for prokaryotic phosphatidylinositol-phospholipase C (PI-PLC) and trypanosomal GPI-PLC, which release the alpha(2)delta proteins from membranes and intact cells and expose a cross-reacting determinant epitope. PI-PLC does not affect control transmembrane or membrane-associated proteins. Furthermore, mutation of the predicted GPI-anchor sites markedly reduced plasma membrane and detergent-resistant membrane localization of alpha(2)delta subunits. We also show that GPI anchoring of alpha(2)delta subunits is necessary for their function to enhance calcium currents, and PI-PLC treatment only reduces calcium current density when alpha(2)delta subunits are coexpressed. In conclusion, this study redefines our understanding of alpha(2)delta subunits, both in terms of their role in calcium-channel function and other roles in synaptogenesis.


Conflict of interest statement

The authors declare no conflict of interest.

Figures

Fig. 1.
Fig. 1.
Evidence that α2δ-3 is GPI-anchored. (A) Amino acid sequence of rat α2δ-3 C terminus showing the peptide used to generate the δ-3 (1035-1049) Ab in red, the two predicted GPI-anchor sites (potential ω amino acids arrowed and underlined in purple), and the C-terminal hydrophobic sequence (green). (B Upper) Immunoblot profile of WT α2δ-3 in lipid-raft fractions (DRM) from transfected tsA-201 cells using α2-3 (71–90) Ab. (Lower) Flotillin distribution in the same DRM profile. (C) Immunoblot of heterologously expressed α2δ-3 in DRM fraction five, before and after incubation with PI-PLC and subsequent deglycosylation with endoglycosidase F (EndoF) as indicated. Deglycosylation was performed, because it enables accurate assessment of the protein MW and generally enhances immunoreactivity of the anti-peptide Abs. The Ab used was anti-δ-3 (1035-1049). The arrows show the upward shift of the δ-3 protein after PI-PLC. Similar results were obtained with PI-PLC from three different commercial sources. (D) Immunoblot profile of hippocampal α2δ-3 with α2-3 (71-90) Ab (Top) and flotillin (Bottom) in DRM fractions. (E) Hippocampal α2δ-3 in DRM fraction five after deglycosylation with EndoF before and after PI-PLC as indicated. (Top) Immunoblot with α2-3 Ab; (Bottom) immunoblot with δ-3 Ab. (Left) Equal loading of both lanes (25 μg protein); (Right) 8 μg protein in left lane and 20 μg in right lane to better compare the upward mobility shift after PI-PLC treatment, which is indicated by arrows. (F) PI-PLC-treated material from hippocampal DRM fraction five was subjected to phase separation in Triton X-114. This procedure is used to identify GPI-anchored proteins. The intact, amphipathic protein remains in the detergent-rich phase, whereas the PI-PLC-cleaved hydrophilic form is found in the detergent-poor (aqueous) phase (asterisk; see SI Materials and Methods (13). Western blots were performed on the detergent and aqueous phases to identify the presence of the different proteins. (Top) α2-3. (Middle) Flotillin. (Bottom) δ-3 showing protein in the detergent (left two lanes) and aqueous phases (right two lanes) with and without PI-PLC treatment as indicated. The α2-3 and δ-3 are indicated by an asterisk in the aqueous phase. Below this is shown a parallel blot that was probed with the CRD Ab, which shows a band at the level of δ-3 in the aqueous phase that was only observed after PI-PLC treatment (arrow). (G Left) Mean I-V relationship for CaV2.2/β1b coexpressed with α2δ-3 in tsA-201 cells and treated for 90 min with vehicle (▪ n = 5) or with PI-PLC (4 U/mL; red • n = 11). (Right) Representative IBa currents (steps from −30 mV to +15 mV from a holding potential of −90 mV) are shown for the vehicle-treated control (black traces, Upper) and PI-PLC-treated (red traces, Lower) conditions; 1 mM Ba2+ was used as charge carrier. (H) Mean I-V relationship for CaV2.2/β1b expressed without α2δ in tsA-201 cells and treated for 90 min with a vehicle control (▪ n = 11), a control in which the same amount of water was added (□ n = 20), or a control with PI-PLC (4 U/mL; red • n = 28). No significant differences were observed under any of the conditions. Note that 5 mM Ba2+ was used as the charge carrier, because the currents were very small in 1 mM Ba2+.
Fig. 2.
Fig. 2.
Evidence that GPI-anchoring of α2δ-3 is required for cell-surface localization and function. (A Left) Immunoblot profile of GAS-WKW α2δ-3 (Upper) and CGG-WKW α2δ-3 (Lower) in DRM fractions from transfected tsA-201 cells using α2-3 (71–90) Ab. (Right) Bar chart showing the average proportion of the total α2δ-3 found to be in DRM (sucrose gradient fractions 4–6) for WT α2δ-3 (black bar), CGG-WKW α2δ-3 (blue bar), and GAS-WKW α2δ-3 (red bar) from two independent experiments each. (B) Mean I-V relationship for CaV2.2/β1b coexpressed with WT α2δ-3 (▪ n = 12), with GAS-WKW α2δ-3 (red • n = 25), or without α2δ (△ n = 23) in tsA-201 cells. All recordings are in 5 mM Ba2+. (C) Peak IBa (mean ± SEM) measured at +15 mV was determined from I-V relationships including those in A. CaV2.2/β1b is shown without α2δ (white bar; n = 36), with WT α2δ-3 (black bar; n = 16), with CGG-WKW α2δ-3 (blue bar; n = 22), or with GAS-WKW α2δ-3 (red bar; n = 25). Data were pooled from several experiments and normalized to the respective control (+WT α2δ-3) in each experiment. The statistical significances of the differences compared to +WT α2δ-3 were determined by ANOVA and post hoc Bonferroni test. **, P < 0.001. Example IBa currents (from −30 mV to +15 mV from a holding potential of −90 mV) are shown above the bars for no α2δ (gray), WT α2δ-3 (black), CGG-WKW α2δ-3 (blue), and GAS-WKW α2δ-3 (red). (D Upper) Cell-surface biotinylation of α2δ-3 (WT), CGG-WKW α2δ-3 and GAS-WKW α2δ-3. The left three lanes show WCL, and the right six lanes show WT and mutant α2δ-3 after cell-surface biotinylation, before and after deglycosylation with EndoF as indicated. Open arrow, full-length α2δ-3; closed arrow, cleaved α2-3. Lower shows lack of biotinylation of cytoplasmic Akt. (E) Quantification of relative amounts of full-length α2δ-3 and cleaved α2-3 for the CGG-WKW α2δ-3 (blue) and GAS-WKW α2δ-3 (red) mutants at the cell surface from two experiments, including the data shown in C, that were normalized to the amount in the WCL. (F) Confocal microscopic images showing membrane localization of α2δ-3 using the δ-3 Ab (Left, red) for WT (Upper) and CGG-WKW α2δ-3 (Lower) when coexpressed with green fluorescent protein CaV2.2 (Middle) and β1b in nonpermeabilized Cos-7 cells. (Right) Merged images show nuclear staining with DAPI (blue). Note that cell-surface staining in nonpermeabilized Cos-7 cells is seen, not as a fine ring but as a wide annulus, because of the flattened geometry (see also Fig. S3A). (Scale bar: 50 μm on merged images.) (G) Quantification of cell-surface immunofluorescence using δ-3 Ab for WT α2δ-3 (black bars; n = 68), CGG-WKW α2δ-3 (blue bars; n = 38), and GAS-WKW α2δ-3 (red bars; n = 38). Statistical significance is P < 0.001 for one-way ANOVA and Tukey’s post hoc tests.
Fig. 3.
Fig. 3.
Biochemical and functional evidence that α2δ-2 is anchored by GPI. (A) Amino acid sequence of mouse α2δ-2 C terminus showing the peptides used to generate the δ-2 (1062-1079), δ-2 (1080-1094), and δ-2 (1133-1147; C-terminus, CT) Abs in blue, red, and pink, respectively. The predicted GPI-anchor site (in purple and underlined with ω indicated by the arrow) and the C-terminal hydrophobic sequence (green) are also shown. (B) Immunoblot of δ-2 from peak DRM fractions prepared from an α2δ-2 stable cell line (14), which shows the absence of immunoreactivity to the C-terminal δ-2 (1133-1147) Ab (Left; see Fig. S4A for validation of this Ab) but immunoreactivity to other δ-2 Abs (1062-1079; Center) and (1080-1094; Right). (C) Immunoblot of δ-2 from the peak DRM fraction derived from α2δ-2–expressing tsA-201 cells before and after incubation with PI-PLC and subsequent deglycosylation with EndoF as indicated. The Ab used was δ-2 (1080-1094). The arrows show the upward shift of the δ-2 protein after PI-PLC. (D Top) Immunoblot of α2-2 from the peak DRM fraction derived from cerebellum before and after incubation with PI-PLC as indicated and subsequent deglycosylation with EndoF. (Middle) Immunoblot of δ-2 from the same fractions. A mixture of all anti–δ-2 Abs was used for this immunoblot. The arrows show the upward shift of the δ-2 protein after PI-PLC. (Bottom) Immunoblot of δ-2 with the δ-2 (1133-1147; CT) Ab alone from the same fractions before PI-PLC treatment, which shows the absence of immunoreactivity. (E) Immunoprecipitated HA-tagged α2δ-2 treated or not treated with PI-PLC before purification is indicated in panel 1. Silver-stained gel was used for the affinity-purified HA-tagged α2δ-2; full-length α2δ-2 is the main species purified by this procedure, possibly because of the greater accessibility of the HA tag. These data also confirm that the PI-PLC used does not have any significant proteolytic activity, because no proteolytic fragments of α2δ-2 were observed after 3 h of incubation. Panel 2 shows corresponding anti-HA blot; panel 3 shows blot for α2-2 with α2-2 (102-117) Ab. Panels 1–3 used 3–8% Tris acetate gel. Panel 4 shows the blot for δ-2 with δ-2 (1080-1094) Ab using a 12% Bis-Tris gel for better resolution of δ-2. Arrows indicate the position of α2δ-2, and arrowheads show α2-2 and δ-2. The material shown in panel 1 was then adjusted to equal protein concentration before immunoblotting for CRD. (F) Immunoblot with anti-CRD Ab. Lane 1 shows α2δ-2 without PI-PLC treatment. Lane 2 shows α2δ-2 after PI-PLC treatment. Lane 3 shows deglycosylated α2δ-2 without PI-PLC treatment. Lane 4 shows deglycosylated α2δ-2 after PI-PLC treatment that showed an ∼170-kDa band corresponding to HA-a2δ-2 and a 150-kDa band corresponding to deglycosylated HA–α2δ-2 (arrows). The CRD antibody has a low affinity, and we were unable to examine immunoreactivity against a band corresponding to free δ-2, because very little was purified using the internal HA tag in α2-2 (see silver-stained gel and δ-2 blot in E). (G) Effect of acute incubation of Cos-7 cells for 1 h with PI-PLC (4 U/mL) on cell-surface localization of transfected 5′NT and α2δ-2. Representative confocal microscopic images of α2δ-2 (102-117 Ab; Upper) and 5′NT (Lower) cell-surface expression in transfected nonpermeabilized COS-7 cells (nuclei visualized with DAPI) were treated with either vehicle (con, left) or PI-PLC (right). (Scale bar: 20 μm.) (H) Quantification of immunofluorescence data similar to those shown in G were obtained from epifluorescence images for 5′NT incubated with vehicle (black bar; n = 25) or PI-PLC (Glyko; hatched bar; n = 31) and for α2δ-2 incubated with vehicle (white bar; n = 30) or PI-PLC (cross-hatched bar; n = 20). The statistical significances of the differences with and without PI-PLC treatment were determined by Student's t test. *, P = 0.0083 for 5′NT; **, P = 0.0019 for α2δ-2. (I Upper) Mean I-V relationship for CaV2.2/β1b coexpressed with α2δ-2 (▪ n = 12), with α2δ-2 GAS-WKW (red • n = 24), or without α2δ (△ n = 18) in tsA-201 cells. All recordings are in 5 mM Ba2+. (Lower) Example IBa currents (from −30 mV to +15 mV from a holding potential of −90 mV) are shown for no α2δ (gray), α2δ-2 (black), and GAS-WKW α2δ-2 (red).
Fig. 4.
Fig. 4.
Evidence that GPI anchoring of α2δ-1 is required for cell-surface localization and function. (A) Amino acid sequence of rat α2δ-1 C terminus showing the predicted GPI-anchor sites (ω) and the C-terminal hydrophobic sequence (green). (B and C) Lysates from the hippocampus were incubated with vehicle (B) or PI-PLC (C) at 37°C in the presence of protease inhibitors, and then they were subjected to sucrose gradient centrifugation. (Upper) The immunoblot profile of α2δ-1 in DRMs from hippocampus is shown using the α2-1 monoclonal Ab. (Lower) Flotillin distribution in same DRM profile. (D) Phase separation of α2-1 after PI-PLC treatment. (Upper) Peak DRM fraction before phase separation showing input for α2-1 and flotillin. (Lower) Phase separation after vehicle or PI-PLC treatment and Triton X-114 extraction shows α2-1 in aqueous phase after PI-PLC (indicated by asterisk). Flotillin was not redistributed into the aqueous phase after PI-PLC treatment. (E Left) Immunolocalization of α2δ-1 in nonpermeabilized DRG neurons after 2 days in culture after incubation with vehicle (Upper; confocal field contains 12 DRG neurons) or with 4 U/mL PI-PLC for 60 min (Lower; field contains 10 DRG neurons). (Scale bar: 50 μm.) (Right) Quantification of α2δ-1 immunostaining expressed as number of pixels per cell (log10 scale) in the intensity range 500-3,000 for 18 images from three different coverslips for each condition, each containing between 5 and 12 cells (Upper). Black line, vehicle-treated; red line, 4 U/mL PI-PLC; blue line, 8 U/mL PI-PLC. (Lower) Quantification of immunostaining in four separate experiments after vehicle (black bar; normalized to 100%) relative to PI-PLC (4 U/mL or 8 U/mL; red bar). **, P < 0.001 for Student's t test. (F) Immunoblot of supernatant after PI-PLC treatment of DRGs, as in E, for 4 U/mL and 8 U/mL PI-PLC. The arrow shows the presence of α2-1. (G) Cartoon showing the structure of α2δ subunits that is identified here. The GPI anchor consists of ethanolamine (orange), three mannose rings (blue), glucosamine (pink), and inositol (yellow). (H) Proposed scheme for processing α2δ proteins. The N-terminal signal sequence is in gray, the C-terminal GPI signal sequence is in green, the α2 sequence is in black, and the δ sequence is in white. The GPI anchor is drawn as in G. The position of the ω amino acid is indicated by a purple arrow in G and H.

Similar articles

Cited by

References

    1. Flockerzi V, et al. Purified dihydropyridine-binding site from skeletal muscle t-tubules is a functional calcium channel. Nature. 1986;323:66–68. - PubMed
    1. Takahashi M, Seagar MJ, Jones JF, Reber BFX, Catterall WA. Subunit structure of dihydropyridine-sensitive calcium channels from skeletal muscle. Proc Natl Acad Sci USA. 1987;84:5478–5482. - PMC - PubMed
    1. Catterall WA. Structure and regulation of voltage-gated Ca2+ channels. Annu Rev Cell Dev Biol. 2000;16:521–555. - PubMed
    1. Ellis SB, et al. Sequence and expression of mRNAs encoding the α 1 and α 2 subunits of a DHP-sensitive calcium channel. Science. 1988;241:1661–1664. - PubMed
    1. De Jongh KS, Warner C, Catterall WA. Subunits of purified calcium channels. α 2 and δ are encoded by the same gene. J Biol Chem. 1990;265:14738–14741. - PubMed

Publication types