Competition-colonization dynamics in an RNA virus
- PMID: 20080701
- PMCID: PMC2836666
- DOI: 10.1073/pnas.0909787107
Competition-colonization dynamics in an RNA virus
Abstract
During replication, RNA viruses rapidly generate diverse mutant progeny which differ in their ability to kill host cells. We report that the progeny of a single RNA viral genome diversified during hundreds of passages in cell culture and self-organized into two genetically distinct subpopulations that exhibited the competition-colonization dynamics previously recognized in many classical ecological systems. Viral colonizers alone were more efficient in killing cells than competitors in culture. In cells coinfected with both competitors and colonizers, viral interference resulted in reduced cell killing, and competitors replaced colonizers. Mathematical modeling of this coinfection dynamics predicted selection to be density dependent, which was confirmed experimentally. Thus, as is known for other ecological systems, biodiversity and even cell killing of virus populations can be shaped by a tradeoff between competition and colonization. Our results suggest a model for the evolution of virulence in viruses based on internal interactions within mutant spectra of viral quasispecies.
Conflict of interest statement
The authors declare no conflict of interest.
Figures


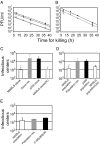
 ). Experimental fitness values were obtained from virus competition experiments. Two representative clones each of MARLS and p200 subpopulations were mixed at equal PFU, and challenged in competitions with variable initial MOI. Reference p200 and MARLS populations (p200p5d) were also mixed in direct competition at variable initial MOI. Relative fitness values obtained in each competition for both clones and populations are plotted against MOI (▲). Experimental measurements with standard errors (solid line) and model predictions (dashed line) were fitted by linear regression. Procedures for fitness value measurements and competition experiments are detailed in Materials and Methods and the
 Similar articles
-
Competition-colonization dynamics: An ecology approach to quasispecies dynamics and virulence evolution in RNA viruses.Commun Integr Biol. 2010 Jul;3(4):333-6. doi: 10.4161/cib.3.4.11658. Commun Integr Biol. 2010. PMID: 20798818 Free PMC article.
-
Molecular basis for a lack of correlation between viral fitness and cell killing capacity.PLoS Pathog. 2007 Apr;3(4):e53. doi: 10.1371/journal.ppat.0030053. PLoS Pathog. 2007. PMID: 17432933 Free PMC article.
-
Dynamics of mutation and recombination in a replicating population of complementing, defective viral genomes.J Mol Biol. 2006 Jul 14;360(3):558-72. doi: 10.1016/j.jmb.2006.05.027. Epub 2006 May 24. J Mol Biol. 2006. PMID: 16797586
-
Evolution of foot-and-mouth disease virus.Virus Res. 2003 Jan;91(1):47-63. doi: 10.1016/s0168-1702(02)00259-9. Virus Res. 2003. PMID: 12527437 Review.
-
Population dynamics of RNA viruses: the essential contribution of mutant spectra.Arch Virol Suppl. 2005;(19):59-71. doi: 10.1007/3-211-29981-5_6. Arch Virol Suppl. 2005. PMID: 16355868 Review.
Cited by
-
Competition-colonization dynamics: An ecology approach to quasispecies dynamics and virulence evolution in RNA viruses.Commun Integr Biol. 2010 Jul;3(4):333-6. doi: 10.4161/cib.3.4.11658. Commun Integr Biol. 2010. PMID: 20798818 Free PMC article.
-
Coinfection and Interference Phenomena Are the Results of Multiple Thermodynamic Competitive Interactions.Microorganisms. 2021 Sep 29;9(10):2060. doi: 10.3390/microorganisms9102060. Microorganisms. 2021. PMID: 34683381 Free PMC article.
-
Mutagenesis-mediated decrease of pathogenicity as a feature of the mutant spectrum of a viral population.PLoS One. 2012;7(6):e39941. doi: 10.1371/journal.pone.0039941. Epub 2012 Jun 28. PLoS One. 2012. PMID: 22761933 Free PMC article.
-
Seasonal variation of respiratory pathogen colonization in asymptomatic health care professionals: A single-center, cross-sectional, 2-season observational study.Am J Infect Control. 2015 Aug;43(8):865-70. doi: 10.1016/j.ajic.2015.04.195. Epub 2015 Jun 4. Am J Infect Control. 2015. PMID: 26052103 Free PMC article.
-
Quasispecies as a matter of fact: viruses and beyond.Virus Res. 2011 Dec;162(1-2):203-15. doi: 10.1016/j.virusres.2011.09.018. Epub 2011 Sep 16. Virus Res. 2011. PMID: 21945638 Free PMC article. Review.
References
-
- Eigen M. Selforganization of matter and the evolution of biological macromolecules. Naturwissenschaften. 1971;58:465–523. - PubMed
-
- Eigen M, Schuster P. The Hypercycle. A Principle of Natural Self-Organization. Berlin: Springer; 1979. - PubMed
-
- Domingo E, Sabo D, Taniguchi T, Weissmann C. Nucleotide sequence heterogeneity of an RNA phage population. Cell. 1978;13:735–744. - PubMed
-
- Batschelet E, Domingo E, Weissmann C. The proportion of revertant and mutant phage in a growing population, as a function of mutation and growth rate. Gene. 1976;1:27–32. - PubMed
Publication types
MeSH terms
Substances
Associated data
- Actions
- Actions
- Actions
LinkOut - more resources
Full Text Sources

