

Precipitation extreme changes exceeding moisture content increases in MIROC and IPCC climate models
- PMID: 20080720
- PMCID: PMC2818899
- DOI: 10.1073/pnas.0903186107
Precipitation extreme changes exceeding moisture content increases in MIROC and IPCC climate models
Abstract
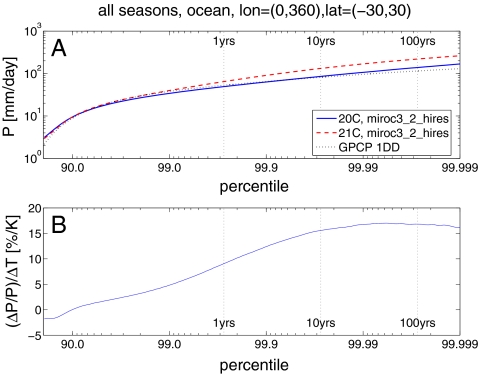
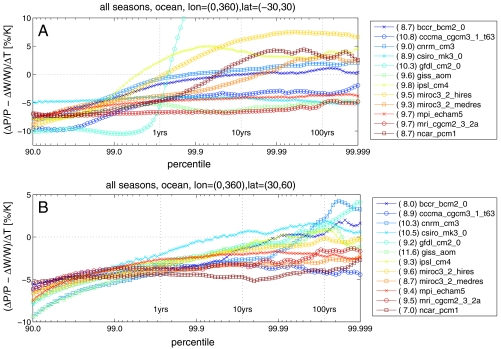
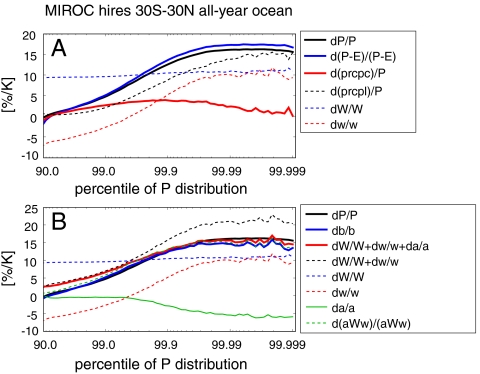
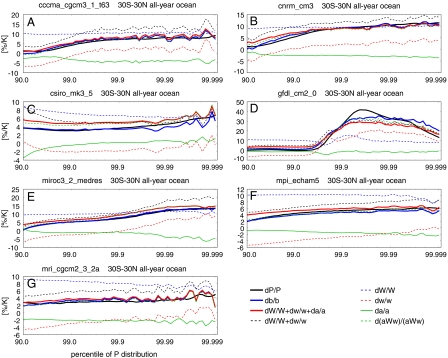
Precipitation extreme changes are often assumed to scale with, or are constrained by, the change in atmospheric moisture content. Studies have generally confirmed the scaling based on moisture content for the midlatitudes but identified deviations for the tropics. In fact half of the twelve selected Intergovernmental Panel on Climate Change (IPCC) models exhibit increases faster than the climatological-mean precipitable water change for high percentiles of tropical daily precipitation, albeit with significant intermodel scatter. Decomposition of the precipitation extreme changes reveals that the variations among models can be attributed primarily to the differences in the upward velocity. Both the amplitude and vertical profile of vertical motion are found to affect precipitation extremes. A recently proposed scaling that incorporates these dynamical effects can capture the basic features of precipitation changes in both the tropics and midlatitudes. In particular, the increases in tropical precipitation extremes significantly exceed the precipitable water change in Model for Interdisciplinary Research on Climate (MIROC), a coupled general circulation model with the highest resolution among IPCC climate models whose precipitation characteristics have been shown to reasonably match those of observations. The expected intensification of tropical disturbances points to the possibility of precipitation extreme increases beyond the moisture content increase as is found in MIROC and some of IPCC models.
Conflict of interest statement
The authors declare no conflict of interest.
Figures
References
-
- Held IM, Soden BJ. Robust responses of the hydrological cycle to global warming. J Climate. 2006;19:5686–5699.
-
- Trenberth KE. Conceptual framework for changes of extremes of the hydrological cycle with climate change. Climate Change. 1999;42:327–339.
-
- Allen MR, Ingram WJ. Constraints on future changes in climate and the hydrologic cycle. Nature. 2002;419:224–232. - PubMed
-
- Lenderink G, van Meijgaard E. Increases in hourly precipitation extremes beyond expectations from temperature changes. Nat Geosci. 2008;1:511–514.
-
- Emori S, Brown SJ. Dynamic and thermodynamic changes in mean and extreme precipitation under changed climate. Geophys Res Lett. 2005;32:L17706.
Publication types
MeSH terms
LinkOut - more resources
Full Text Sources
Medical
Molecular Biology Databases
