. 2010 Jan 12;107(2):610-5.
doi: 10.1073/pnas.0909597107. Epub 2009 Dec 18.

Cytoskeleton-based forecasting of stem cell lineage fates

Affiliations

Cytoskeleton-based forecasting of stem cell lineage fates

Matthew D Treiser et al. Proc Natl Acad Sci U S A. .

Abstract

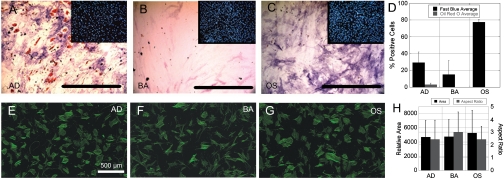
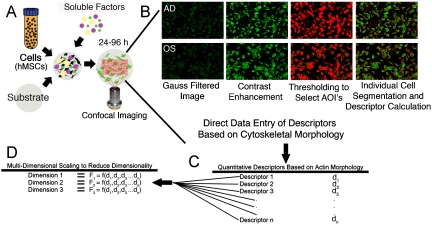
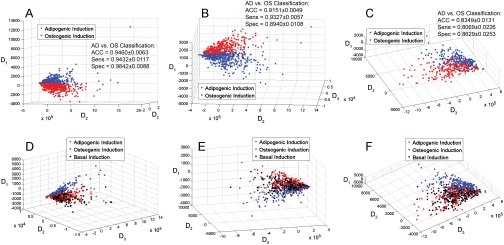
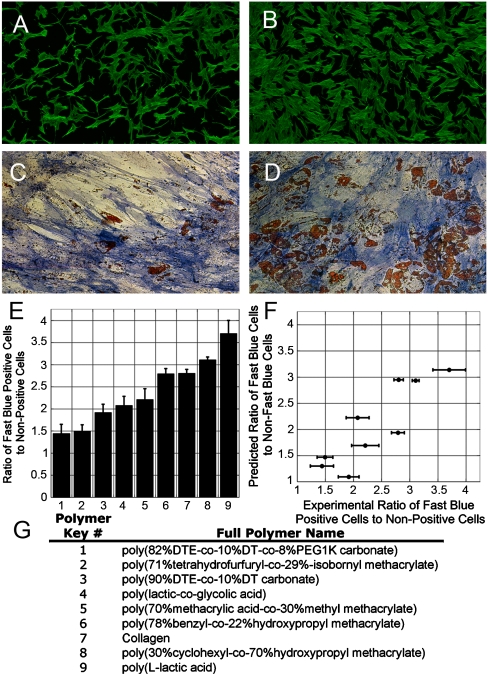
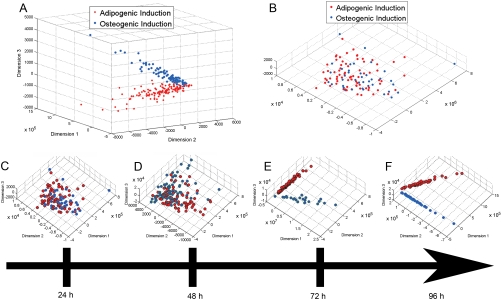
Stem cells that adopt distinct lineages cannot be distinguished based on traditional cell shape. This study reports that higher-order variations in cell shape and cytoskeletal organization that occur within hours of stimulation forecast the lineage commitment fates of human mesenchymal stem cells (hMSCs). The unique approach captures numerous early (24 h), quantitative features of actin fluororeporter shapes, intensities, textures, and spatial distributions (collectively termed morphometric descriptors). The large number of descriptors are reduced into "combinations" through which distinct subpopulations of cells featuring unique combinations are identified. We demonstrate that hMSCs cultured on fibronectin-treated glass substrates under environments permissive to bone lineage induction could be readily discerned within the first 24 h from those cultured in basal- or fat-inductive conditions by such cytoskeletal feature groupings. We extend the utility of this approach to forecast osteogenic stem cell lineage fates across a series of synthetic polymeric materials of diverse physicochemical properties. Within the first 24 h following stem cell seeding, we could successfully "profile" the substrate responsiveness prospectively in terms of the degree of bone versus nonbone predisposition. The morphometric methodology also provided insights into how substrates may modulate the pace of osteogenic lineage specification. Cells on glass substrates deficient in fibronectin showed a similar divergence of lineage fates, but delayed beyond 48 h. In summary, this high-content imaging and single cell modeling approach offers a framework to elucidate and manipulate determinants of stem cell behaviors, as well as to screen stem cell lineage modulating materials and environments.


Conflict of interest statement

The authors declare no conflict of interest.

Figures

Fig. 1.
Fig. 1.
hMSCs display growth factor dependent differentiation behaviors at 2 weeks that are not apparent at 24 h. hMSCs were cultured on fibronectin-coated glass substrates at 3,000 cells per cm2 for 2 weeks in either (A) AD media, (B) BA or, (C) OS induction media. Differentiation behaviors for OS and AD phenotype were assessed by Fast Blue Staining (Blue stain) for positive alkaline phosphatase activity or Oil Red O staining (Red stain) for intracellular lipid accumulation respectively (FBOR). Inlays represent corresponding images of fluorescently labeled nuclei. (D) Quantitative analysis of FBOR staining demonstrates 75% fast blue positive cells in OS media and significantly (p < 0.05) less fast blue positive cells and almost no oil red O positive cells in AD and BA media. Error bars represent the standard deviation of N = 2 independent experiments. hMSCs were cultured for 18 h in (E) AD media (F) BA media, and (G) OS media. Cells were fixed and then stained for actin at 24 h of total culture time. (H) Traditional cell shape parameters (cell area and aspect ratio) demonstrated no significant differences between AD, BA, and OS-treated hMSCs at 24 h. Error bars represent the standard deviation for N = 350–437 cells.
Fig. 2.
Fig. 2.
The development of descriptor-based computational modeling approaches to parse hMSCs at 24 h in culture: (A) A quantitative approach was undertaken to parse cell fates. Tile scan images for single experiments were obtained and underwent image processing (B) to yield a list of 43 morphometric descriptors that described whole cell shape and cytoskeletal distribution. (B) Individual cell images were processed utilizing a ten pass Gaussian filter and then image enhanced (image contrast, brightness and gamma value adjustment), and a thresholding process employed to segment individual whole cells based on the image intensity histogram. Shape and higher-order moment descriptors for segmented cell elements were then calculated as shown in (C). (D) Utilizing MDS, the 43 dimensional descriptor space (denoted by d1,d2,…dn) was combined in a nonlinear fashion to create a new 3-dimensional space to visualize the data. The new dimensions (referred in Fig. 3 as D1–D3) represent components of all of the original 43 descriptors combined into 3 different nonlinear combinations. In the MDS, each point represents the three-dimensional descriptor coordinates for a single cell cultured under the defined media condition.
Fig. 3.
Fig. 3.
Cytoskeleton-based descriptors segment and identify individual osteoblastic cells within hMSCs cultures exposed to soluble factors. MDS, utilizing the morphometric descriptors to create three new dimensions (D1–D3) that each represent nonlinear combinations of the 43 descriptors, demonstrates that individual cells exposed to OS media (Blue) cluster separately from cells in either AD (Red) (AC) or BA (Black) (DF) media. All cells were cultured on fibronectin/glass at 3,000 cells per cm2. This segmentation was observed in at least three different cultures consisting of two donors (Donor 1 was a 36-year-old-old male (A, D, B, E); Donor 2 was a 22-year-old female (C, F) and two passages (2 (A, C, D, F) and 4 (B, E)). No segmentation was observed between the AD and BA media conditions (DF). For (AC) data is pooled from four different wells for each condition, in (DF) data are pooled from two wells for each condition. (AC) Support vector machine (SVM) classification of clustering shows that OS vs. AD classification can be achieved with high accuracy (ACC), sensitivity (Sens), and specificity (Spec). Error reported on SVM classification represents the standard deviation for ACC, Sens, and Spec for N = 50 twofold cross validation pseudoexperiments of MDS data plotted in (AC).
Fig. 4.
Fig. 4.
Altered hMSC osteoblastic commitment resulting from substrate may be predicted based on MDS at 24 h. (AB) At constant seeding density (21,000 cells per cm2) and applied soluble cues (MX media) synthetic substrates alter the percentage of cells that differentiate toward the osteoblastic lineage at 2 weeks as assessed by FBOR staining. FBOR images are shown for polymer 8 (A) and 1 (B). (CD) While the FBOR staining in (AB) shows differences in the ratio of osteoblastic versus nonosteoblastic cells on different substrates, no obvious qualitative morphologic parameters of cytoskeletal morphology are seen that can distinguish these outcomes in the 24 h tile scan actin-stained images shown for the same polymers (example shown for polymers 8 (C) and 1 (D)). (E) Quantification of the ratio of fast blue positive cells to nonfast blue positive cells for each substrate shows ratios ranging from approximately 1.5 to 3.75. Error bars represent the standard deviation of N = 2–4 experiments per substrate. (F) Scatter plot with the X-axis representing the ratio of 2 week osteoblastic cells to nonosteoblastic cells, versus the 24 h morphometric/MDS prediction for the same ratio (Y-axis). A high degree of correlation between the prediction and observed percent of osteoblasts was seen (Pearson correlation coefficient = 0.87). The X error bars represent the standard deviation for N = 2–4 independent experiments. (G) Table listing full polymer names with corresponding keyed system shown in (F).
Fig. 5.
Fig. 5.
Cytoskeletal based morphometric segmentation kinetics occur in a ligand-dependent manner. hMSCs were cultured in either AD or OS media on glass substrates with (A) and without (B) fibronectin pretreatment for 24 h and the time course of descriptors was obtained. At 24 h the fibronectin-pretreated substrates demonstrate a clear segmentation of the hMSCs treated with AD or OS induction whereas glass alone conditions do not. On nontreated glass, the cytoskeletal based segmentation process becomes progressively more pronounced with culture time (CF). The MDS of cells taken at 24 h (C), 48 h (D), 72 h (E), and 96 h (F) are shown. Cells on untreated glass showed no segmentation until 72 h of culture.

References

    1. Thomson JA, et al. Embryonic stem cell lines derived from human blastocysts. Science. 1998;282(5391):1145–1147. - PubMed
    1. Park IH, et al. Reprogramming of human somatic cells to pluripotency with defined factors. Nature. 2008;451(7175):141–146. - PubMed
    1. Pittenger MF, et al. Multilineage potential of adult human mesenchymal stem cells. Science. 1999;284(5411):143–147. - PubMed
    1. Curran JM, Chen R, Hunt JA. The guidance of human mesenchymal stem cell differentiation in vitro by controlled modifications to the cell substrate. Biomaterials. 2006;27(27):4783–4793. - PubMed
    1. Engler AJ, Sen S, Sweeney HL, Discher DE. Matrix elasticity directs stem cell lineage specification. Cell. 2006;126(4):677–689. - PubMed

Publication types

MeSH terms