. 2010 Jan 12;107(2):715-20.
doi: 10.1073/pnas.0910909107. Epub 2009 Dec 18.

Conformational transitions in DNA polymerase I revealed by single-molecule FRET

Affiliations

Conformational transitions in DNA polymerase I revealed by single-molecule FRET

Yusdi Santoso et al. Proc Natl Acad Sci U S A. .

Abstract

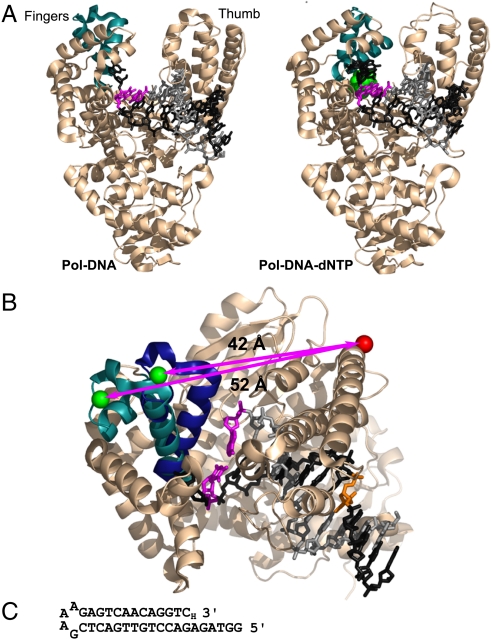
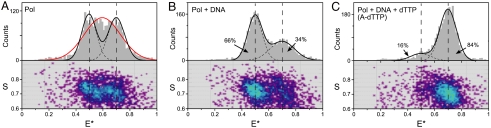
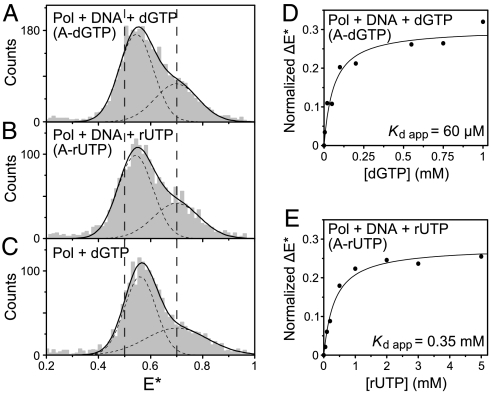
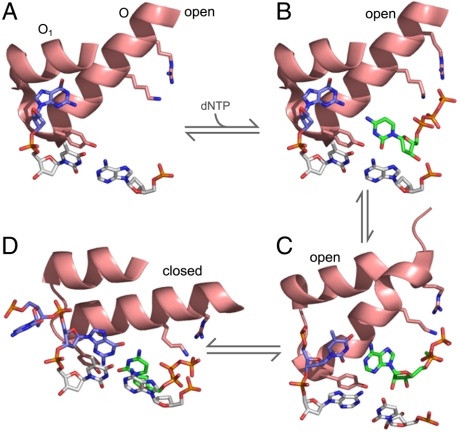
The remarkable fidelity of most DNA polymerases depends on a series of early steps in the reaction pathway which allow the selection of the correct nucleotide substrate, while excluding all incorrect ones, before the enzyme is committed to the chemical step of nucleotide incorporation. The conformational transitions that are involved in these early steps are detectable with a variety of fluorescence assays and include the fingers-closing transition that has been characterized in structural studies. Using DNA polymerase I (Klenow fragment) labeled with both donor and acceptor fluorophores, we have employed single-molecule fluorescence resonance energy transfer to study the polymerase conformational transitions that precede nucleotide addition. Our experiments clearly distinguish the open and closed conformations that predominate in Pol-DNA and Pol-DNA-dNTP complexes, respectively. By contrast, the unliganded polymerase shows a broad distribution of FRET values, indicating a high degree of conformational flexibility in the protein in the absence of its substrates; such flexibility was not anticipated on the basis of the available crystallographic structures. Real-time observation of conformational dynamics showed that most of the unliganded polymerase molecules sample the open and closed conformations in the millisecond timescale. Ternary complexes formed in the presence of mismatched dNTPs or complementary ribonucleotides show unique FRET species, which we suggest are relevant to kinetic checkpoints that discriminate against these incorrect substrates.


Conflict of interest statement

The authors declare no conflict of interest.

Figures

Fig. 1.
Fig. 1.
The fingers-closing conformational change in Pol I(KF). (A) The open Pol-DNA binary complex (PDB file 1L3U) and closed Pol-DNA-dNTP ternary complex (PDB file 1LV5) are illustrated using structural data from B. stearothermophilus (Bst) DNA polymerase (3), a close homologue of Pol I(KF). The α-carbon backbone of the protein is shown in Beige, except for the mobile segment of the fingers subdomain in Teal. The DNA template strand is in Dark Gray, the primer strand in Light Gray. The terminal base pair at the active site is Magenta, and the incoming complementary dNTP is Green. (B) Superposition of the open and closed structures shown in (A), viewed from above the polymerase active site. The mobile portion of the fingers subdomain (residues 680 to 714, equivalent to Pol I residues 732 to 766) is shown in Teal in the binary complex and Dark Blue in the ternary complex. The backbone structure of the rest of the protein, shown in Beige, is taken from the 1L3U PDB file but is essentially the same in both structures. The β carbons of the two side chains used as fluorophore attachment sites are shown in space-filling representation; residue 744 in Green, and residue 550 in red (Pol I residue numbers); the arrows indicate the distance between the Cβ positions in the open and closed conformations. The DNA primer-template is colored as in (A), except for the T(-8) position (Orange), which served as the attachment site for a dabcyl quencher in some experiments (see Fig. S1). The illustrations in (A) and (B) were made using PyMOL (DeLano Scientific). (C) DNA-hairpin oligonucleotide used in single-molecule FRET experiments. A dideoxy nucleotide (3′-H) prevents covalent addition to the 3′ end.
Fig. 2.
Fig. 2.
FRET-related histograms for Pol I(KF) complexes. (AC) FRET-related histograms for (A) unliganded R550G744 Pol I(KF), (B) the Pol-DNA binary complex, and (C) the Pol-DNA-dNTP ternary complex (with a correct dNTP, forming an A-dTTP pair). The numbers of bursts in A, B, and C are comparable (2731, 2908, and 2598 events, respectively). The binary complex was formed by adding 100 nM DNA to Pol I(KF); the ternary complex was formed by adding 100 nM DNA and 10 μM dTTP to Pol I(KF). Each sample is described by two histograms: The lower shows a two-dimensional histogram of probe stoichiometry, S, vs. apparent FRET efficiency, E, for each diffusing molecule that contains both G and R fluorophores (i.e., molecules with 0.6 < S < 0.9; see SI Materials and Methods and refs. 14, 31). The upper panel shows a one-dimensional E histogram (80 bins) of the molecules in the lower panel. In (B) and (C), the E distributions were fitted to double-Gaussian distributions (black solid lines, sum of Gaussians; dashed lines, individual Gaussians) using an iterative process (see SI Materials and Methods). The percentage of the population in each Gaussian (after correction for the contaminating G550R744 protein) is indicated. The two dashed vertical lines mark the mean E values of the main subpopulations in the binary (open) and ternary (closed) complexes. For the unliganded Pol I(KF) in (A), the red line shows the best fit by a single Gaussian; the black dashed lines show a fit to a constrained double-Gaussian distribution with the means and standard-deviations of the Gaussian peaks set to equal those of the open (〈E〉 = 0.5, σSN = 0.054) and closed (〈E〉 = 0.7, σSN = 0.060) complexes determined from the data in (B) and (C); neither of these strategies provide a good fit to the experimental data (see text). The residuals of all fits are in Fig. S5.
Fig. 3.
Fig. 3.
Real-time conformational dynamics of unliganded Pol I(KF). (A) Examples of timetraces of long fluorescence bursts (≥8 ms; for burst selection, see SI Materials and Methods) for a static-DNA control and unliganded Pol I(KF) molecules diffusing in solution (for a large gallery of bursts, see Fig. S7). The upper panel shows photon counts upon donor excitation in the donor (Green) and acceptor (Red) emission channels, as well as photon counts upon acceptor excitation in the acceptor emission channel (Gray), all partitioned in 0.5-ms time bins; the lower panel shows the corresponding E traces. For the static-DNA burst shown, E fluctuations display a standard-deviation (σE) approaching the shot-noise-limited standard-deviation of E [σESN; calculated as in (16)]; for the Pol I(KF) burst shown, E fluctuations significantly exceed the shot-noise limit. (B) Standard-deviation analysis: simulations. Plots of E and σE for bursts of > 4 ms taken from simulated timetraces, selected based on FAex,Aem photons and using L = 30, M = 6, T = 0.5 ms; see SI Materials and Methods). Dotted parabola: shot-noise-limited σE at different E values for a 20-photon segment. A static sample displays a distribution with a mean σE value matching the shot-noise limit. A two-state system (state one with E = 0.5; state two with E = 0.7) that fluctuates at a timescale (k1 = k-1 = 17 s-1) much slower than diffusion (τD = 3 ms) displays two shot-noise-limited distributions (Red contours); when the same system fluctuates around the timescale of diffusion (k1 = k-1 = 166 s-1), it displays an additional, wide population (centered at E ≈ 0.6) with σE that exceeds the shot-noise limit by 5–15%. A further 10-fold increase in the interconversion rate leads to a single, narrow distribution (centered at E ∼ 0.6) with σE that exceeds the shot-noise limit by ≈20%. (C) Standard-deviation analysis experiments. Burst analysis and display as in panel B. Unliganded Pol I(KF) displays a profile similar to the one predicted for interconversions occurring around the timescale of diffusion, whereas the rest of the samples appear static on that timescale. (D) Determination of interconversion rates using FCS on samples in polyacrylamide gels. (Top): donor autocorrelation [GDD(τ), Black line] and donor-acceptor cross correlation [GDA(τ), Red line] curves for unliganded Pol normalized such that the GDD(τ) curve falls between 0 and 1. The amplitude of the cross correlation curve is proportional to the relative concentration of doubly labeled species; thus, samples with different donor-acceptor concentrations have different maximum correlation amplitudes. (Bottom): ratios of GDD(τ) and GDA(τ) for unliganded Pol (Dark Gray) and a static-DNA control (Light Gray). The curve segments above 10 ms are dominated by noise (due to the low amplitude of the correlation curves) and were not fitted. While the control showed no dynamics, the unliganded Pol exhibited a large fluctuation that was fitted (Blue line) with a stretched exponential function with mean relaxation time of ≈3 ms (see SI Materials and Methods). (E) Same as in D, Bottom, but for binary and ternary complexes. No significant fluctuations were observed during the probed timescale.
Fig. 4.
Fig. 4.
Novel FRET species observed for Pol I(KF) ternary complexes with incorrect substrates. (AC) E histograms of the doubly labeled molecules (0.6 < S < 0.9, as in Fig. 2) in (A) a Pol-DNA-dNTP ternary complex with mispaired A-dGTP (1 mM dGTP), (B) a Pol-DNA-rNTP ternary complex with complementary A-rUTP (1 mM UTP), and (C) a binary Pol-dNTP complex (lacking DNA) with 1 mM dGTP. In (A) and (B), the DNA (Fig. 1C) was present at 100 nM; control experiments (Fig. S8D) established that DNA was present in these complexes. The vertical dashed lines correspond to the mean E for the open (E = 0.5) and closed (E = 0.7) conformations that predominate in the binary and matched ternary complexes, respectively (Fig. 2). The E histograms were fitted to double-Gaussian distributions (solid black lines, sum of Gaussians; dashed lines, individual Gaussians). In all cases, the fit of the lower-E subpopulation was unconstrained, whereas the mean of the higher-E subpopulation (which gives rise to a shoulder) was fixed at E = 0.7, corresponding to the closed conformation. At high nucleotide concentration (1 mM), all three experiments showed a shift of the mean of the lower-E peak to a position at ≈25% of the difference between the mean E values of the open and closed conformations. (D) Nucleotide dependence of the E shift for the A-dGTP mispaired ternary complex. See Fig. S8A for the E histograms at each dGTP concentration. The shift of the mean of the lower-E peak was normalized relative to the E difference between the means of the open and closed conformations. Normalized ΔE was plotted as a function of nucleotide concentration, and an apparent equilibrium dissociation constant Kd app was obtained by fitting to a hyperbolic function. (E) As in (D), but for the A-rUTP ternary complex. See Fig. S8B for the E histograms at each rUTP concentration.
Fig. 5.
Fig. 5.
Proposed reaction pathway for the prechemistry steps at the polymerase active site, based on cocrystal structures. In (A)–(D), the structures are reduced to the minimal elements that illustrate important features of the reaction. These comprise the O-helix or its structural homologue (which moves during fingers-closing), part of the O1 helix (not mobile), the invariant Tyr at the C terminus of the O-helix, conserved Lys and Arg side chains that interact with the dNTP phosphates, the terminal base pair (Gray) of the primer template, the unpaired base(s) on the template strand (Blue), and the incoming dNTP (Green). (A) The Pol-DNA binary complex of Bst Pol (PDB file 1L3U) represents the start of the reaction. The O-helix is in the open conformation, Tyr is stacked on the template base of the terminal base pair and the next templating base is in a pocket between the O and O1 helices (3). (B) A model for the initial complex when a dNTP associates with the Pol-DNA complex, generated by aligning the structure in (A) with a structure of Klentaq with a bound dNTP in the absence of DNA (PDB file 5KTQ) (20). The positions of the dCTP molecule and the Lys and Arg side chains were based on the Klentaq coordinates. (C) A plausible candidate for the complex in which the incoming nucleotide is tested for complementarity with the templating base, provided by a cocrystal of T7 RNA polymerase (a structural homologue of the A-family DNA polymerases; PDB file 1SOV). This structure is remarkable in that it shows base pairing between the templating base and an incoming nucleotide outside of the active site pocket, while the O-helix, terminal base pair and Tyr side chain maintain positions characteristic of the open complex (30). The nucleotide and templating base have moved only slightly from their positions in (B). (D) The closed Pol-DNA-dNTP complex of Bst Pol (PDB file 1LV5) represents the end of the sequence, with the reactants poised for catalysis (3); this step is the checkpoint for the rejection of rNTPs. Compared to (A), rotation of the O-helix and downwards movement of the Tyr side chain have created a binding pocket for the nascent base pair.

Similar articles

Cited by

References

    1. Joyce CM, Benkovic SJ. DNA polymerase fidelity: kinetics, structure, and checkpoints. Biochemistry. 2004;43:14317–14324. - PubMed
    1. Li Y, Korolev S, Waksman G. Crystal structures of open and closed forms of binary and ternary complexes of Thermus aquaticus DNA polymerase I: Structural basis for nucleotide incorporation. EMBO J. 1998;17:7514–7525. - PMC - PubMed
    1. Johnson SJ, Taylor JS, Beese LS. Processive DNA synthesis observed in a polymerase crystal suggests a mechanism for the prevention of frameshift mutations. Proc Natl Acad Sci USA. 2003;100:3895–3900. - PMC - PubMed
    1. Doublié S, Sawaya MR, Ellenberger T. An open and closed case for all polymerases. Structure. 1999;7:R31–R35. - PubMed
    1. Rothwell PJ, Mitaksov V, Waksman G. Motions of the fingers subdomain of Klentaq1 are fast and not rate limiting: implications for the molecular basis of fidelity in DNA polymerases. Mol Cell. 2005;19:345–355. - PubMed

Publication types

MeSH terms