. 2010 Jan 12;107(2):803-8.
doi: 10.1073/pnas.0913491107. Epub 2009 Dec 22.

Genomic scale analysis of racial impact on response to IFN-alpha

Affiliations

Genomic scale analysis of racial impact on response to IFN-alpha

Zoltan Pos et al. Proc Natl Acad Sci U S A. .

Abstract

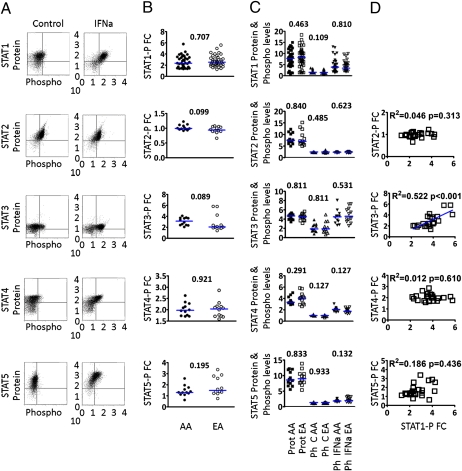
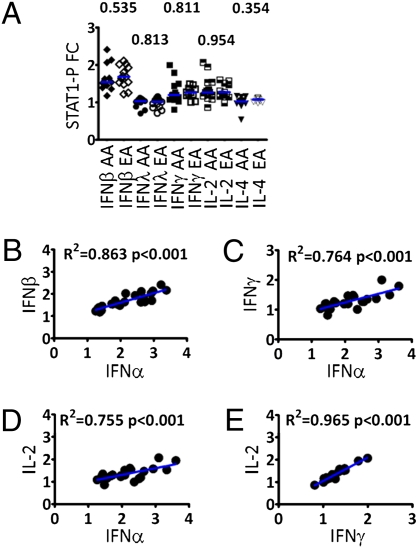
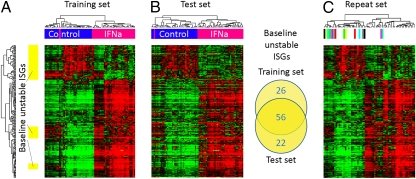
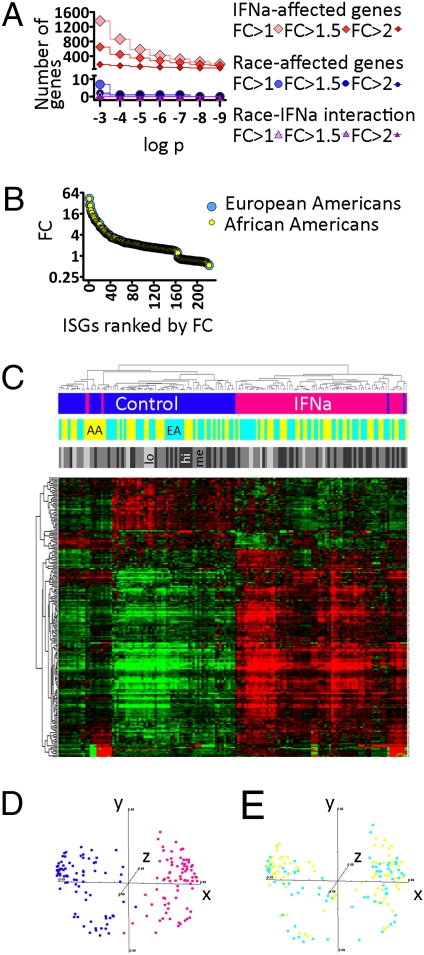
Limited responsiveness to IFN-alpha in hepatitis C virus (HCV)-infected African-Americans compared to European Americans (AAs vs. EAs) hinders the management of HCV. Here, we studied healthy non-HCV-infected AA and EA subjects to test whether immune cell response to IFN-alpha is determined directly by race. We compared baseline and IFN-alpha-induced signal transducer and activator of transcription (STAT)-1, STAT-2, STAT-3, STAT-4, and STAT-5 protein and phosphorylation levels in purified T cells, global transcription, and a genomewide single-nucleotide polymorphism (SNP) profile of healthy AA and EA blood donors. In contrast to HCV-infected individuals, healthy AAs displayed no evidence of reduced STAT activation or IFN-alpha-stimulated gene expression compared to EAs. Although >200 genes reacted to IFN-alpha treatment, race had no impact on any of them. The only gene differentially expressed by the two races (NUDT3, P < 10(-7)) was not affected by IFN-alpha and bears no known relationship to IFN-alpha signaling or HCV pathogenesis. Genomewide analysis confirmed the self-proclaimed racial attribution of most donors, and numerous race-associated SNPs were identified within loci involved in IFN-alpha signaling, although they clearly did not affect responsiveness in the absence of HCV. We conclude that racial differences observed in HCV-infected patients in the responsiveness to IFN-alpha are unrelated to inherent racial differences in IFN-alpha signaling and more likely due to polymorphisms affecting the hosts' response to HCV, which in turn may lead to a distinct disease pathophysiology responsible for altered IFN signaling and treatment response.


Conflict of interest statement

The authors declare no conflict of interest.

Figures

Fig. 1.
Fig. 1.
No difference between healthy EAs’ and AAs’ IFN-α-induced STAT1, STAT2, STAT3, STAT4, and STAT5 activation. Activity of STAT1, STAT2, STAT3, STAT4, and STAT5 signal pathways is displayed, as affected by IFN-α and race. (A) Representative flow cytometry data for each STAT protein. (B) IFN-α-induced fold change in STAT protein phosphorylation. (C) STAT protein levels (STAT Prot), baseline (Ph C), and IFN-α-induced (Ph IFNa) STAT phosphorylation levels. Median is indicated by horizontal lines, and P values obtained from Student's t-tests or the Mann–Whitney rank sum test, as appropriate, are shown above sample groups. (D) Correlation between STAT1 and other STAT proteins’ phosphorylation in the same samples along with R and P values obtained from Pearson's correlation analyses.
Fig. 2.
Fig. 2.
Healthy EAs and AAs do not differ in activation of STAT1 by various cytokines, using signal transduction pathways overlapping with IFN-α. (A) Fold change STAT1 phosphorylation induced by various cytokines capable of activating STAT1, as indicated, with IL-4 serving as negative control. (BE) Correlations between STAT1 phosphorylation induced by various cytokines along with R and P values obtained from Pearson's correlation analyses.
Fig. 3.
Fig. 3.
Characterization of IFN-α-stimulated genes, assessment of response heterogeneity, and stability of individual differences in healthy EAs and AAs. (A) IFN-α-stimulated genes (ISGs) identified by microarrays and mixed-effects model ANOVA (P > 10−7, FC >1.5) in a “training” sample set consisting of 78 samples. (B) The same ISG set is tested for reproducibility by unsupervised hierarchical clustering of an independent “test” sample set of 78 samples, collected from different individuals. Untreated controls are labeled with purple and IFN-α-treated samples with pink bars. Major heterogeneity between individuals is shown in the form of ISGs displaying frequent, IFN-α-independent activation in the control groups. These genes, designated as baseline unstable ISGs, are shown marked with yellow bars. (C) Limited stability of this phenomenon over time in a third, “repeat” sample set consisting of samples derived from identical donors at two different time points. Samples derived from the same individuals are shown color coded.
Fig. 4.
Fig. 4.
Healthy EAs and AAs do not differ in IFN-α-induced ISG activation. (A) Summary of the number of genes affected by IFN-α treatment, race, and interaction between race and treatment as defined by mixed-effects model ANOVAs applying various combinations of fold change and significance criteria. (B) Analysis of the impact of race on average ISG response intensity by displaying trimmed mean (5–5% on both ends) fold change values of individual ISGs, ranked by average fold change. (C) The impact of IFN-α treatment on ISG expression in comparison with race and STAT1 phosphorylation by unsupervised hierarchical clustering. Samples are color coded for treatment (purple, control; pink, IFNa), race (pale blue, European; yellow, African-American), and STAT1-P FC (pale gray, low STAT1-P FC; medium gray, medium STAT1-P FC; dark gray, high STAT1-P FC). (D and E) Results of a similar analysis after reduction of ISG data complexity to three dimensions (x, y, and z) by multidimensional scaling (MDS). MDS reveals that axis x, representing the principal difference between all samples, is bona fide equivalent with the IFN-α treatment effect, whereas race is virtually irrelevant.
Fig. 5.
Fig. 5.
Identification of SNPs linked to EA and AA genetic background, ISGs, and IFN-α response by whole-genome SNP analysis. (A) Efficient separation of EA and AA donors according to self-proclaimed race by unsupervised hierarchical clustering of 848,365 SNPs; self-proclaimed race is shown by color code (pale blue, European; yellow, African-American). (B) Accuracy of genomic-scale SNP profiling by showing virtually identical SNP patterns obtained from repeated donations (labeled a–e). (C) Distribution of 26,026 SNPs significantly linked to AA background on all human chromosomes (Dataset S1), including 158 race-linked, ISG associated SNPs (Dataset S2). (D) Significantly race-linked SNPs on chromosome 19, which contains a suspected hotspot of IFN-α response. (E) None of the SNPs detected in the hotspot region (blue frame) was significantly linked to race. In CE, the y axis indicates uncorrected P values, whereas horizontal red lines indicate Bonferroni-corrected significance thresholds, equivalent to a global P value of P < 0.05.

Similar articles

Cited by

References

    1. Reddy KR, et al. Racial differences in responses to therapy with interferon in chronic hepatitis C. Consensus Interferon. Study Group. Hepatology. 1999;30:787–793. - PubMed
    1. He XS, et al. Global transcriptional response to interferon is a determinant of HCV treatment outcome and is modified by race. Hepatology. 2006;44:352–359. - PubMed
    1. Layden-Almer JE, Ribeiro RM, Wiley T, Perelson AS, Layden TJ. Viral dynamics and response differences in HCV-infected African American and white patients treated with IFN and ribavirin. Hepatology. 2003;37:1343–1350. - PubMed
    1. Muir AJ, Bornstein JD, Killenberg PG Atlantic Coast Hepatitis Treatment Group. Peginterferon alfa-2b and ribavirin for the treatment of chronic hepatitis C in blacks and non-Hispanic whites. N Engl J Med. 2004;350:2265–2271. - PubMed
    1. Hepburn MJ, Hepburn LM, Cantu NS, Lapeer MG, Lawitz EJ. Differences in treatment outcome for hepatitis C among ethnic groups. Am J Med. 2004;117:163–168. - PubMed

MeSH terms

Associated data