. 2010 Jan 12;107(2):923-8.
doi: 10.1073/pnas.0908491107. Epub 2009 Dec 28.

Optimizing infectious disease interventions during an emerging epidemic

Affiliations

Optimizing infectious disease interventions during an emerging epidemic

Jacco Wallinga et al. Proc Natl Acad Sci U S A. .

Abstract

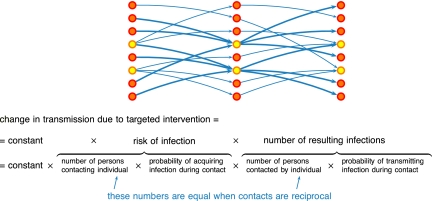
The emergence and global impact of the novel influenza A(H1N1)v highlights the continuous threat to public health posed by a steady stream of new and unexpected infectious disease outbreaks in animals and humans. Once an emerging epidemic is detected, public health authorities will attempt to mitigate the epidemic by, among other measures, reducing further spread as much as possible. Scarce and/or costly control measures such as vaccines, anti-infective drugs, and social distancing must be allocated while epidemiological characteristics of the disease remain uncertain. Here we present first principles for allocating scarce resources with limited data. We show that under a broad class of assumptions, the simple rule of targeting intervention measures at the group with the highest risk of infection per individual will achieve the largest reduction in the transmission potential of a novel infection. For vaccination of susceptible persons, the appropriate risk measure is force of infection; for social distancing, the appropriate risk measure is incidence of infection. Unlike existing methods that rely on detailed knowledge of group-specific transmission rates, the method described here can be implemented using only data that are readily available during an epidemic, and allows ready adaptation as the epidemic progresses. The need to observe risk of infection helps to focus the ongoing planning and design of new infectious disease surveillance programs; from the presented first principles for allocating scarce resources, we can adjust the prioritization of groups for intervention when new observations on an emerging epidemic become available.


Conflict of interest statement

The authors declare no conflict of interest.

Figures

Fig. 1.
Fig. 1.
A schematic representation of transmission of infection in a population that consists of different groups. Individuals are depicted as nodes; potentially infectious contacts from one individual to another are depicted as arrows; and group membership is indicated by node color. Individuals with a yellow node have a larger number of incoming contacts and therefore have a higher risk of infection. Due to reciprocity of contacts, individuals with a yellow node also have a larger number of outgoing contacts and therefore a higher number of infections that they would cause if they become infected. Therefore targeting interventions at individuals in the group with a higher risk of infection (yellow nodes rather than orange nodes) would result in a larger reduction in transmission potential. The sensitivity to targeted intervention of the transmission potential is determined by two components: the risk of infection of an individual, and the number of infections that would result from this individual if infected. When contacts are reciprocal, the number of resulting infections is proportional to the risk of infection.
Fig. 2.
Fig. 2.
A test of the importance-leveling scheme against simulated data. (A) The 21 contact parameters required to describe reciprocal contacts among six age groups, based on self-reported number of social contacts (17). (B) Incidence of infection during the initial phase of the epidemic, as simulated from the contact parameters in panel A. (C) Allocation of a perfect vaccine over six age groups for different stockpile sizes, according to the importance leveling scheme (lines) that uses only information about the incidence of infection as in B; for comparison, we show the optimal allocation that requires knowing the entire contact matrix (dots). (D) Reduction in transmission potential by importance leveling (green line) is indistinguishable from maximal reduction by optimal allocation (blue dots) for stockpile sizes up to 20% of the total population. Both are considerably better than random allocation (orange line). (E) Sensitivity analysis of reduction in transmission potential to age-specific variation in per contact probability of acquiring infection, ai, and per contact probability of transmitting infection, ci. Importance leveling was applied while ignoring the variation in ai and ci (yellow) and while accounting for this variation (green) (Methods). Transmission parameters are scaled such that the largest value equals 1 in A; incidence of infection is scaled such that the largest value equals 1 in B. Size of stockpile is expressed relative to total population size; transmission potential is scaled such that it equals 2.0 when stockpile size is zero in C, D, and E.
Fig. 3.
Fig. 3.
Incidence and force of infection during the “Asian” 1957–1958 influenza A(H2N2) pandemic in the Netherlands, as reconstructed from age-specific records of mortality and from serological cross-sectional surveys conducted in June 1957 and June 1958. (A) Time course of overall weekly incidence of infection. (B) Time course of weekly incidence of infection by age group. (C) Age-specific incidence of infection in week of 18 September 1957, 2 weeks before peak of first pandemic wave, and (D) in week of 29 January 1958, 2 weeks before peak of second pandemic wave. (E) Time course of weekly force of infection by age groups. (F) Age-specific force of infection 2 weeks before peak of first pandemic wave, and (G) age-specific force of infection 2 weeks before peak of second pandemic wave. Gray areas in C, D, F, and G indicate 95% bootstrapped confidence intervals (Methods).
Fig. 4.
Fig. 4.
Incidence by age during first phase of outbreak of A(H1N1)v, as cases per million. (A) Incidence in United States up to 13 May 2009. A total of 3,369 confirmed and probable cases have been reported. Incidence was calculated using 3,097 case patients for which age was reported or could be calculated using date of birth and who did not report a recent history of travel from Mexico. (B) Incidence in Chile up to 21 June 2009. A total of 5,186 confirmed cases have been reported. Incidence was calculated using 5,085 confirmed cases for which age was known (34).

Similar articles

Cited by

References

    1. Woolhouse ME, Haydon DT, Antia R. Emerging pathogens: The epidemiology and evolution of species jumps. Trends Ecol Evol. 2005;20:238–244. - PMC - PubMed
    1. Jones KE, et al. Global trends in emerging infectious diseases. Nature. 2008;451:990–993. - PMC - PubMed
    1. Tildesley MJ, et al. Optimal reactive vaccination strategies for a foot-and-mouth outbreak in the UK. Nature. 2006;440:83–86. - PubMed
    1. Donnelly CA, et al. Epidemiological and genetic analysis of severe acute respiratory syndrome. Lancet Infect Dis. 2004;4:672–683. - PMC - PubMed
    1. Ferguson NM, et al. Strategies for mitigating an influenza pandemic. Nature. 2006;442:448–452. - PMC - PubMed

Publication types

MeSH terms