

Reconstructing influenza incidence by deconvolution of daily mortality time series
- PMID: 20080801
- PMCID: PMC2796142
- DOI: 10.1073/pnas.0902958106
Reconstructing influenza incidence by deconvolution of daily mortality time series
Abstract
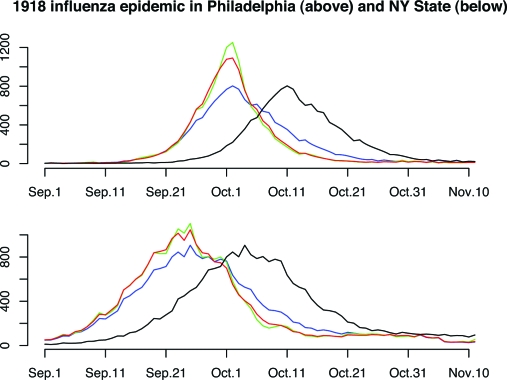
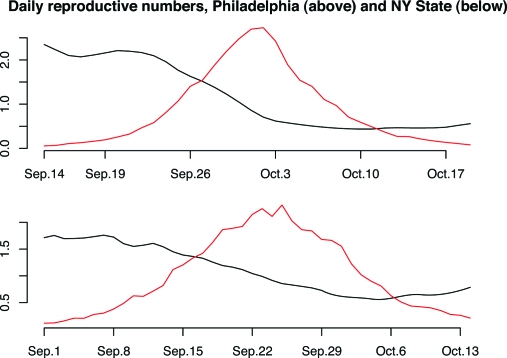
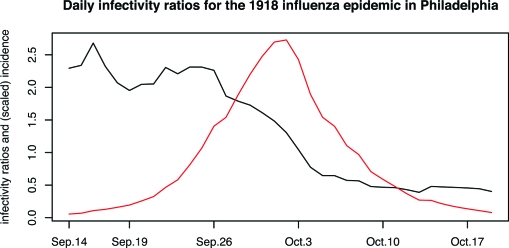
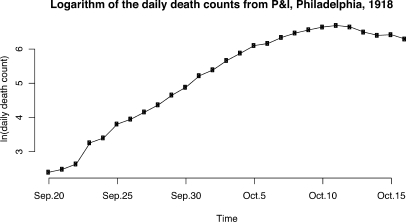
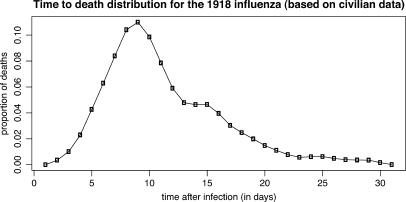
We propose a mathematically straightforward method to infer the incidence curve of an epidemic from a recorded daily death curve and time-to-death distribution; the method is based on the Richardson-Lucy deconvolution scheme from optics. We apply the method to reconstruct the incidence curves for the 1918 influenza epidemic in Philadelphia and New York State. The incidence curves are then used to estimate epidemiological quantities, such as daily reproductive numbers and infectivity ratios. We found that during a brief period before the official control measures were implemented in Philadelphia, the drop in the daily number of new infections due to an average infector was much larger than expected from the depletion of susceptibles during that period; this finding was subjected to extensive sensitivity analysis. Combining this with recorded evidence about public behavior, we conclude that public awareness and change in behavior is likely to have had a major role in the slowdown of the epidemic even in a city whose response to the 1918 influenza epidemic is considered to have been among the worst in the U.S.
Conflict of interest statement
The authors declare no conflict of interest.
Figures
References
-
- Brookmeyer R, Gail M. AIDS Epidemiology: A Quantitative Approach. Oxford: Oxford Univ Press; 1994.
-
- Richardson WH. Bayesian-based iterative method of image restoration. J Opt Soc Am. 1972;62:55–59.
Publication types
MeSH terms
Grants and funding
LinkOut - more resources
Full Text Sources
Medical
