. 2010 Mar;151(3):1109-18.
doi: 10.1210/en.2009-0963. Epub 2010 Jan 15.

Involvement of transducer of regulated cAMP response element-binding protein activity on corticotropin releasing hormone transcription

Affiliations

Involvement of transducer of regulated cAMP response element-binding protein activity on corticotropin releasing hormone transcription

Ying Liu et al. Endocrinology. 2010 Mar.

Abstract

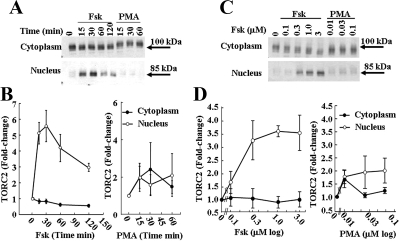
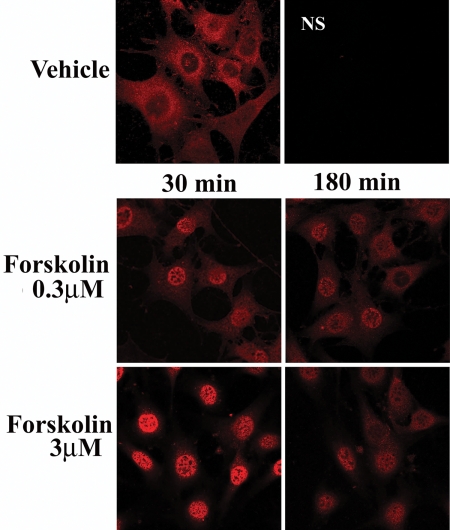
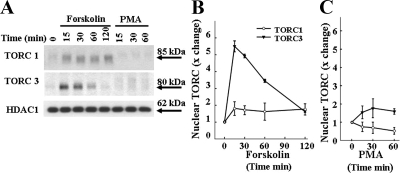
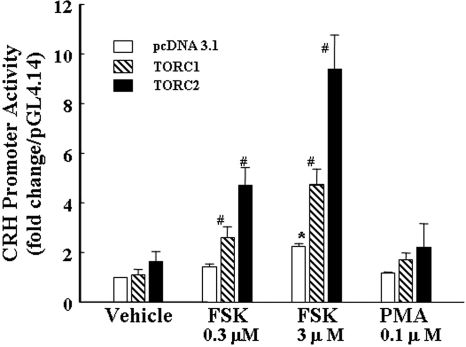
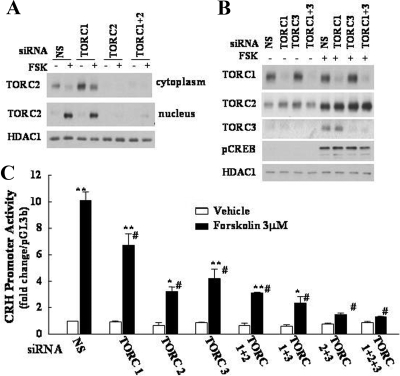
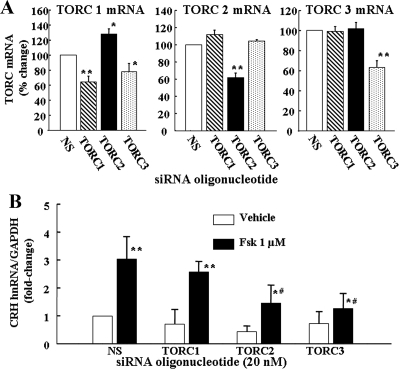
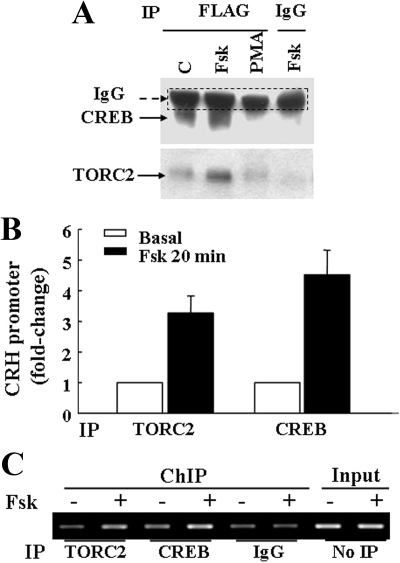
We have recently shown that phospho-cAMP response element-binding protein (CREB) is essential but not sufficient for activation of CRH transcription, suggesting the requirement of a coactivator. Here, we test the hypothesis that the CREB coactivator, transducer of regulated CREB activity (TORC), is required for activation of CRH transcription, using the cell line 4B and primary cultures of hypothalamic neurons. Immunohistochemistry and Western blot experiments in 4B cells revealed time-dependent nuclear translocation of TORC1,TORC 2, and TORC3 by forskolin [but not by the phorbol ester, phorbol 12-myristate 13-acetate (PMA)] in a concentration-dependent manner. In reporter gene assays, cotransfection of TORC1 or TORC2 potentiated the stimulatory effect of forskolin on CRH promoter activity but had no effect in cells treated with PMA. Knockout of endogenous TORC using silencing RNA markedly inhibited forskolin-activated CRH promoter activity in 4B cells, as well as the induction of endogenous CRH primary transcript by forskolin in primary neuronal cultures. Coimmunoprecipitation and chromatin immunoprecipitation experiments in 4B cells revealed association of CREB and TORC in the nucleus, and recruitment of TORC2 by the CRH promoter, after 20-min incubation with forskolin. These studies demonstrate a correlation between nuclear translocation of TORC with association to the CRH promoter and activation of CRH transcription. The data suggest that TORC is required for transcriptional activation of the CRH promoter by acting as a CREB coactivator. In addition, cytoplasmic retention of TORC during PMA treatment is likely to explain the failure of phorbolesters to activate CRH transcription in spite of efficiently phosphorylating CREB.


Figures

Figure 1
Figure 1
Time course (A and B) and dose response (C and D) of the effect of forskolin and PMA on nuclear translocation of TORC2 in 4B cells Cytoplasmic and nuclear proteins from cells treated with vehicle (0.01% DMSO for time and concentration 0), forskolin (Fsk), or PMA were subjected to Western blot analysis for TORC2. Data points are the mean ± se of the values obtained in three experiments, expressed as fold-change from basal values in vehicle treated cells (time 0 in B). Two-way ANOVA revealed significant differences between time-dependent effects of forskolin and PMA in the nucleus (n = 3, P < 0.01, F = 21.4). Using one-way ANOVA (different concentration range impaired two-way analysis) concentration dependence was significant for forskolin (n = 3, P < 0.01, F = 6.0, n = 3) but not of PMA (n = 3, P = 0.3, F = 1.5).
Figure 2
Figure 2
Forskolin induces transient translocation of TORC2 to the nucleus Cells were treated with vehicle (0.01% DMSO), forskolin (0.3 or 3 μm) for 30 min or 3 h before fixation and visualization of endogenous TORC2 by immunofluorescence/confocal microscopy at ×63 magnification. Negative controls were processed in the absence of TORC antibody. NS, nonspecific in the absence of primary anibody.
Figure 3
Figure 3
Time course of the effect of forskolin and PMA on nuclear TORC1 and TORC3 levels Western blot analysis for TORC1 and TORC3 in the same nuclear proteins from cells treated with forskolin (A and B) or PMA (A and C) shown in Fig. 1B. Data points are the mean ± se of the values obtained in three experiments, expressed as fold-change from basal values (time 0, incubated with vehicle, DMSO 0.01%). Western blot images from a representative experiment are shown in A. The time of film exposure required to visualize the TORC bands were 5–10 sec for TORC2 and 10–30 min for TORC1 and TORC3. Two-way ANOVA revealed a significant effect of time with forskolin compared with PMA, P < 0.001, F = 32.4, for TORC1, and P < 0.001, F = 25.0, for TORC3, n = 3).
Figure 4
Figure 4
TORC overexpression potentiates forskolin stimulated CRH promoter activity cells were cotransfected with the expression vector, pcDNA 3.1, empty or containing TORC1 or TORC2 and the CRH promoter reporter construct, CRHp-pGL4 or empty pGL4–14.1, 18 h before stimulation with forskolin or PMA for 6 h before and measurement of luciferase activity. Bars represent the mean ± se of the data obtained in three experiments. *, P < 0.01 vs. pcDNA 3.1-transfected basal (vehicle, 0.01% DMSO); #, P < 0.01 compared with the respective forskolin-stimulated pcDNA 3.1.
Figure 5
Figure 5
Silencing RNA blockade of specific TORC subtypes blunts CRH promoter activity Effect of siRNA blockade of endogenous TORC2 (A) or TORC1 and TORC3 (B) protein levels (A) or CRH promoter activity (C). A, 4B cells cotransfected with CRHp-luc and a nonspecific (NS), TORC1, or TORC2 siRNA, or their combination, were incubated for 20 min with forskolin (FSK) before preparation of cytoplasmic and nuclear protein extracts for Western blot analysis. C, Cotransfected cells were incubated for 6 h with forskolin or vehicle (0.01% DMSO) before measurement of luciferase activity. Bars are the mean ± se of data obtained in three separate experiments, expressed as fold-change from basal in cells transfected with the nonspecific oligonucleotide. **, P < 0.001 forskolin vs. respective basal; *, P < 0.03 forskolin vs. respective basal; #, P < 0.001 vs. forskolin, nonspecific oligonucleotide.
Figure 6
Figure 6
Silencing RNA blockade of specific TORC subtypes reduces forkolin-stimulated CRH transcription in CRH neurons Effect of siRNA blockade of endogenous TORC1, TORC2, or TORC3 on the different TORC subtype mRNA levels (A) or CRH hnRNA levels in primary cultures of hypothalamic neurons (B). Neuronal cultures were transfected with a nonspecific (NS), or TORC1, TORC2, or TORC3 siRNA, and 24 h later incubated for 45 min with forskolin (Fsk) or vehicle (0.01% DMSO) before preparation of total RNA for determination of TORC mRNA and CRH hnRNA by qRT-PCR. Bars are the mean ± se of data obtained in four experiments, expressed as percent change from cells transfected with NS (for TORC mRNA) or fold-change from vehicle in cells transfected with NS. **, P < 0.001 siRNA vs. NS (TORC mRNA), or forskolin vs. respective vehicle (CRH hnRNA); *, P < 0.01 siRNA vs. NS (TORC mRNA), or P < 0.03 forskolin vs. respective vehicle (CRH hnRNA); #, P < 0.001 forskolin siRNA vs. forskolin nonspecific oligonucleotide.
Figure 7
Figure 7
Forskolin induces association of CREB and TORC in the nucleus and TORC recruitment by the CRH promoter (A) 4B cells transfected with TORC/FLAG fusion constructs 18 h earlier, were incubated with forskolin (Fsk) or PMA for 20 min before preparation of nuclear extracts and immunoprecipitation with an anti-FLAG antibody. Western blot analysis of the FLAG immunoprecipitates revealed an increase in coimmunoprecipitation of CREB and TORC2 in nuclear proteins from cells treated with forskolin but not with PMA. A nonspecific immunoglobulin band present just above the CREB band is demarcated by the dashed line. B and C, ChIP assay of CRH promoter DNA using anti-TORC2 and CREB antibodies. 4B cells transfected with the CRH promoter-luciferase construct 18 h earlier were incubated with or without forskolin (Fsk) for 20 min before DNA cross-linking and ChIP assay. B, Quantitative RT-PCR analysis of CRH promoter after immunoprecipitation using anti-TORC2 and CREB antibodies. Bars are the mean ± se of data from four experiments, after subtracting nonspecific values obtained after immunoprecipitation with antirabbit IgG. C, Gel analysis of the PCR product for the CRH promoter in a representative experiment.

Comment in

Similar articles

Cited by

References

    1. Aguilera G 1994 Regulation of pituitary ACTH secretion during chronic stress. Front Neuroendocrinol 15:321–350 - PubMed
    1. Dallman MF, Akana SF, Levin N, Walker C-D, Bradbury MJ, Suemaru S, Scribner KS 1994 Corticosteroids and the control of function in the hypothalamo-pituitary-adrenal (HPA) axis. Ann NY Acad Sci 746:22–28 - PubMed
    1. Munck A, Naray-Fejes-Toth A 1994 Glucocorticoids and stress: permissive and suppressive actions. Ann NY Acad Sci 746:115–130 - PubMed
    1. Herbert J, Goodyer IM, Grossman AB, Hastings MH, de Kloet ER, Lightman SL, Lupien SJ, Roozendaal B, Seckl JR 2006 Do corticosteroids damage the brain? J Neuroendocrinol 18:393–411 - PubMed
    1. McEwen BS, Brinton RE, Sapolsky RM 1988 Glucocorticoid receptors and behavior: implications for the stress response. Adv Exp Med Biol 245:35–45 - PubMed

Publication types