

Movement correction method for human brain PET images: application to quantitative analysis of dynamic 18F-FDDNP scans
- PMID: 20080894
- PMCID: PMC2929579
- DOI: 10.2967/jnumed.109.063701
Movement correction method for human brain PET images: application to quantitative analysis of dynamic 18F-FDDNP scans
Abstract
Head movement during a PET scan (especially a dynamic scan) can affect both the qualitative and the quantitative aspects of an image, making it difficult to accurately interpret the results. The primary objective of this study was to develop a retrospective image-based movement correction (MC) method and evaluate its implementation on dynamic 2-(1-{6-[(2-(18)F-fluoroethyl)(methyl)amino]-2-naphthyl}ethylidene)malononitrile ((18)F-FDDNP) PET images of cognitively intact controls and patients with Alzheimer's disease (AD).
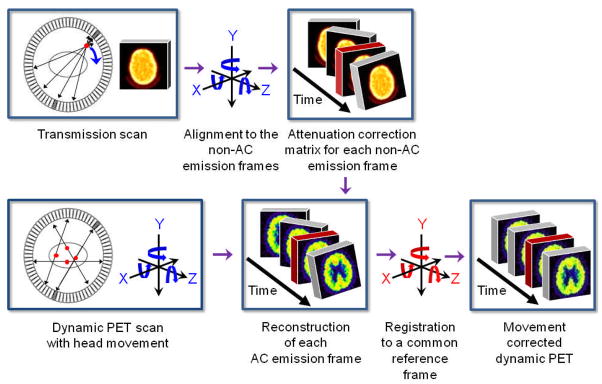
Methods: Dynamic (18)F-FDDNP PET images, used for in vivo imaging of beta-amyloid plaques and neurofibrillary tangles, were obtained from 12 AD patients and 9 age-matched controls. For each study, a transmission scan was first acquired for attenuation correction. An accurate retrospective MC method that corrected for transmission-emission and emission-emission misalignments was applied to all studies. No restriction was assumed for zero movement between the transmission scan and the first emission scan. Logan analysis, with the cerebellum as the reference region, was used to estimate various regional distribution volume ratio (DVR) values in the brain before and after MC. Discriminant analysis was used to build a predictive model for group membership, using data with and without MC.
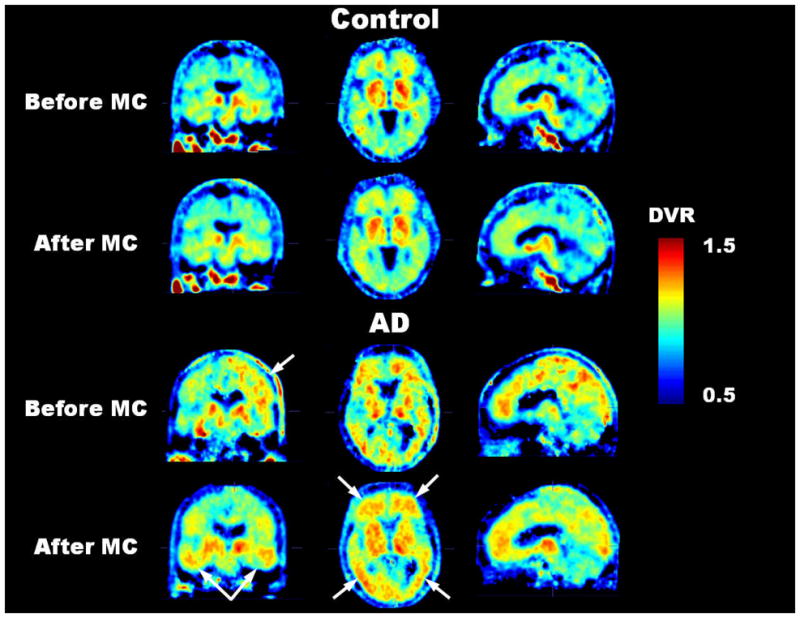
Results: MC improved the image quality and quantitative values in (18)F-FDDNP PET images. In this subject population, no significant difference in DVR value was observed in the medial temporal (MTL) region of controls and patients with AD before MC. However, after MC, significant differences in DVR values in the frontal, parietal, posterior cingulate, MTL, lateral temporal (LTL), and global regions were seen between the 2 groups (P < 0.05). In controls and patients with AD, the variability of regional DVR values (as measured by the coefficient of variation) decreased on average by more than 18% after MC. Mean DVR separation between controls and patients with AD was higher in frontal, MTL, LTL, and global regions after MC. Group classification by discriminant analysis based on (18)F-FDDNP DVR values was markedly improved after MC.
Conclusion: The streamlined and easy-to-use MC method presented in this work significantly improves the image quality and the measured tracer kinetics of (18)F-FDDNP PET images. The proposed MC method has the potential to be applied to PET studies on patients having other disorders (e.g., Down syndrome and Parkinson's disease) and to brain PET scans with other molecular imaging probes.
Figures


References
-
- Buhler P, Just U, Will E, Kotzerke J, van den Hoff J. An accurate method for correction of head movement in PET. IEEE Trans Med Imaging. 2004 Sep;23(9):1176–1185. - PubMed
-
- Herzog H, Tellmann L, Fulton R, et al. Motion artifact reduction on parametric PET images of neuroreceptor binding. J Nucl Med. 2005 Jun;46(6):1059–1065. - PubMed
-
- Huang S-C, Hoffman EJ, Phelps ME, Kuhl DE. Quantitation in positron emission computed tomography: 2. Effects of inaccurate attenuation correction. J Comput Assist Tomogr. 1979 Dec;3(6):804–814. - PubMed
-
- Logan J, Fowler JS, Volkow ND, Wang GJ, Ding YS, Alexoff DL. Distribution volume ratios without blood sampling from graphical analysis of PET data. J Cereb Blood Flow Metab. 1996 Sep;16(5):834–840. - PubMed
-
- Ruttimann UE, Andreason PJ, Rio D. Head motion during positron emission tomography: Is it significant? Psychiatry Res: Neuroimaging. 1995;61:43–51. - PubMed
Publication types
MeSH terms
Substances
Grants and funding
LinkOut - more resources
Full Text Sources