. 2010 Oct;20(10):2391-410.
doi: 10.1093/cercor/bhp308. Epub 2010 Jan 15.

Thalamocortical connections of functional zones in posterior parietal cortex and frontal cortex motor regions in New World monkeys

Affiliations

Thalamocortical connections of functional zones in posterior parietal cortex and frontal cortex motor regions in New World monkeys

Omar A Gharbawie et al. Cereb Cortex. 2010 Oct.

Abstract

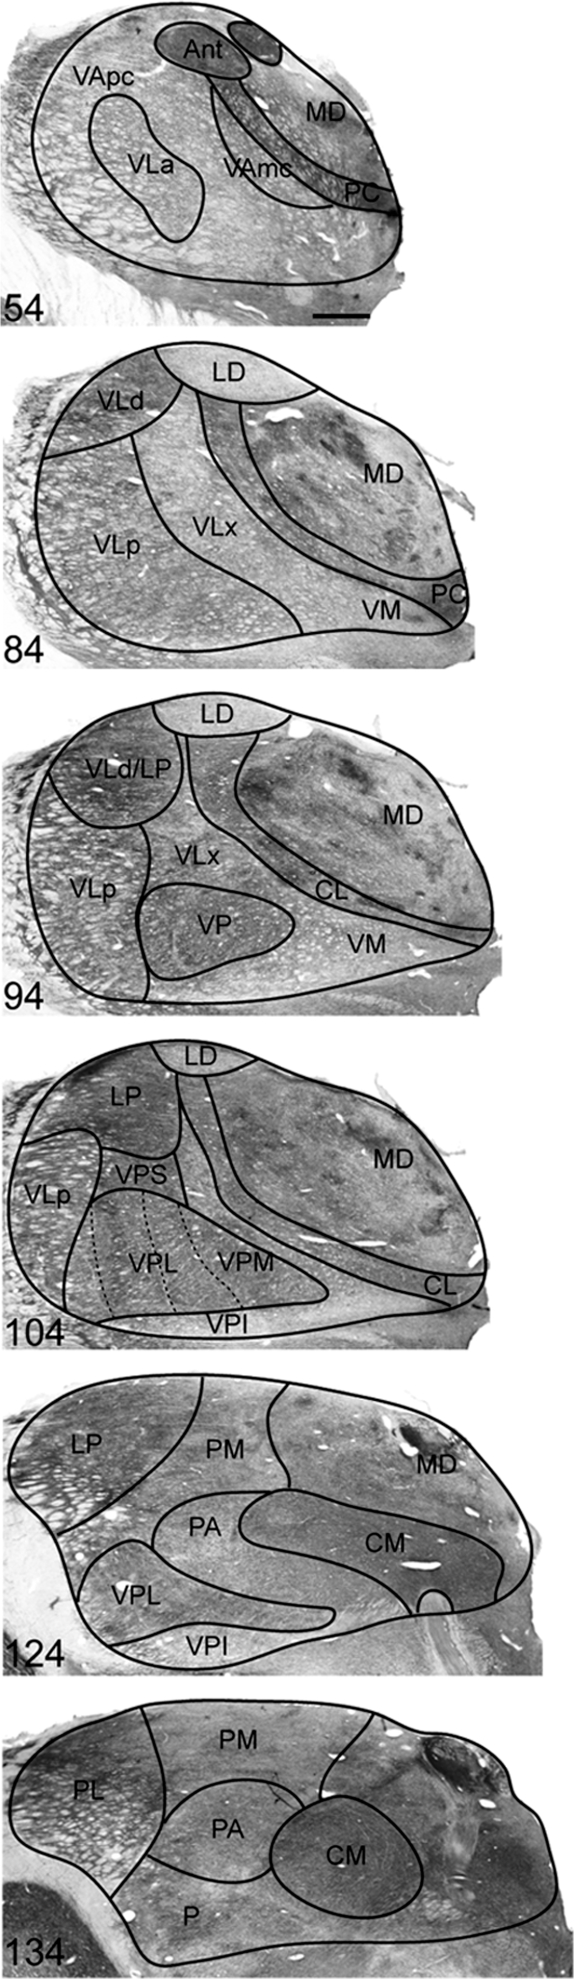
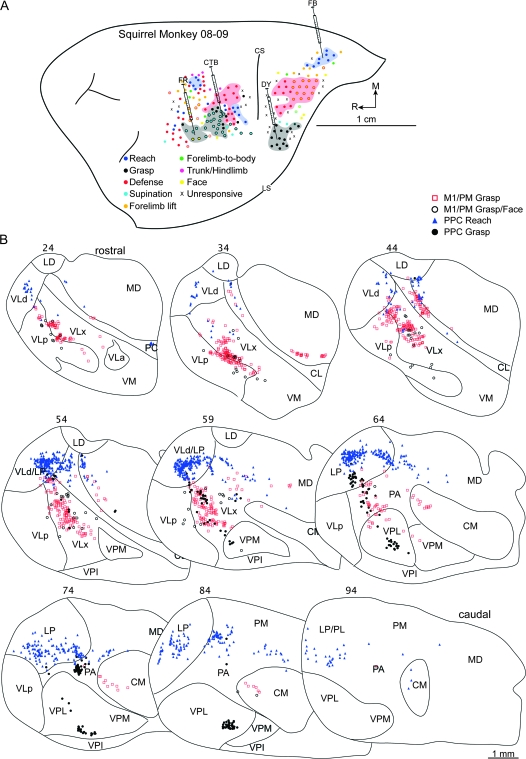
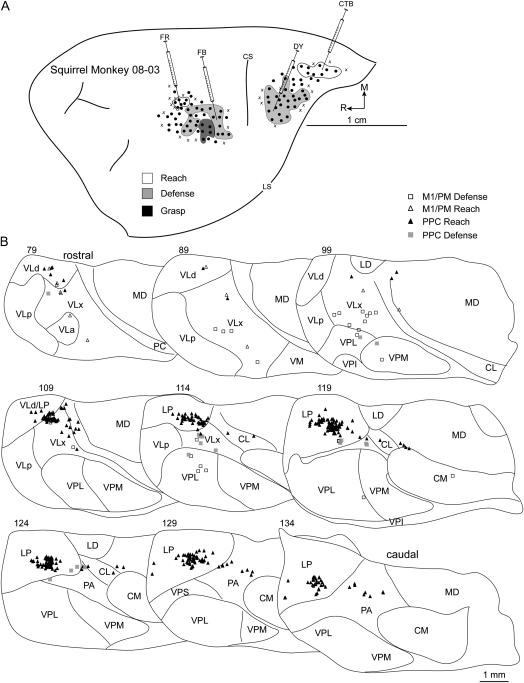
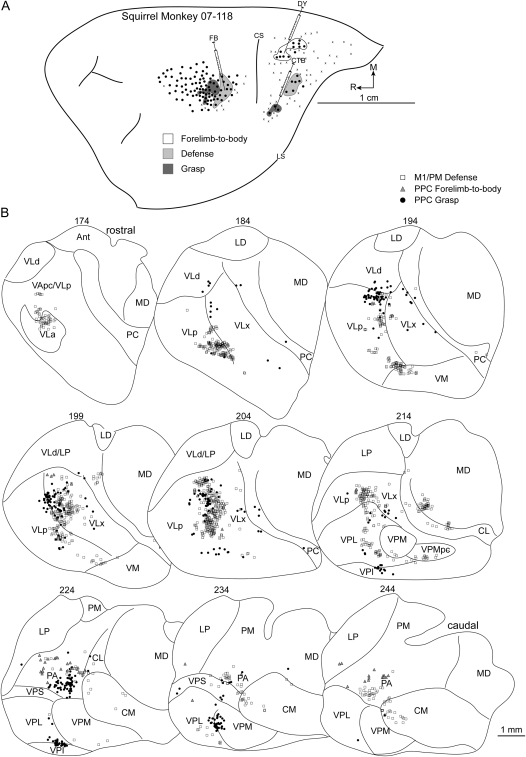
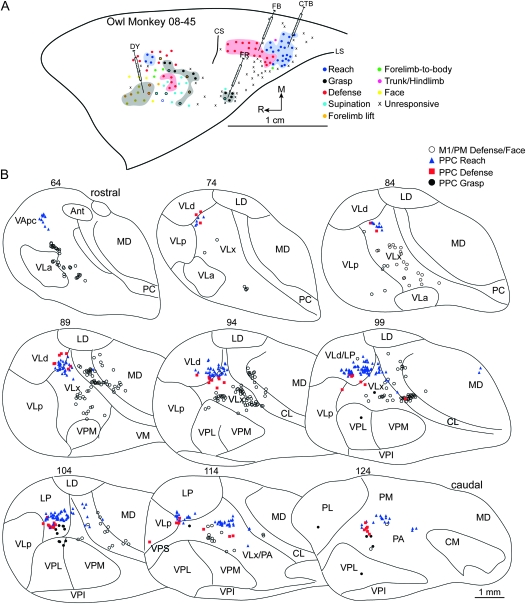
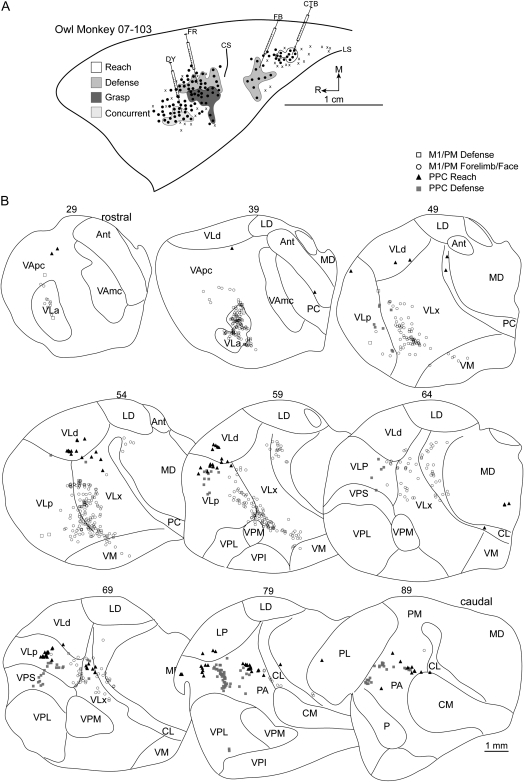
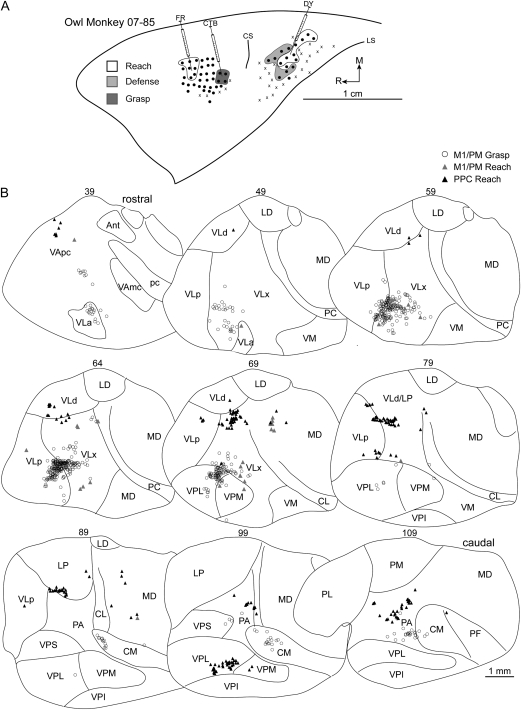
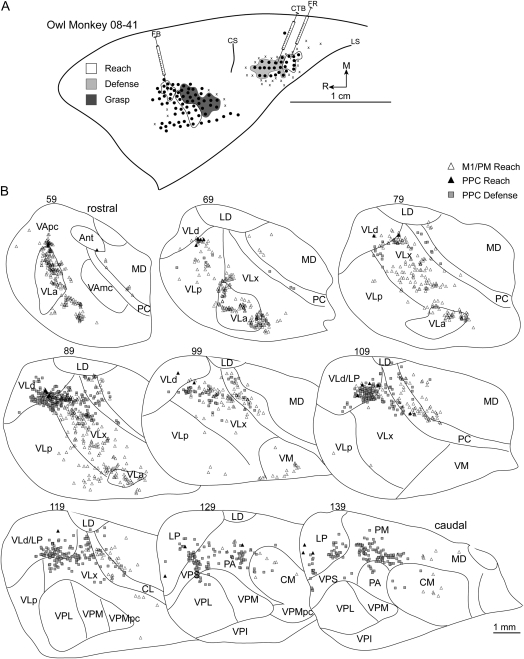
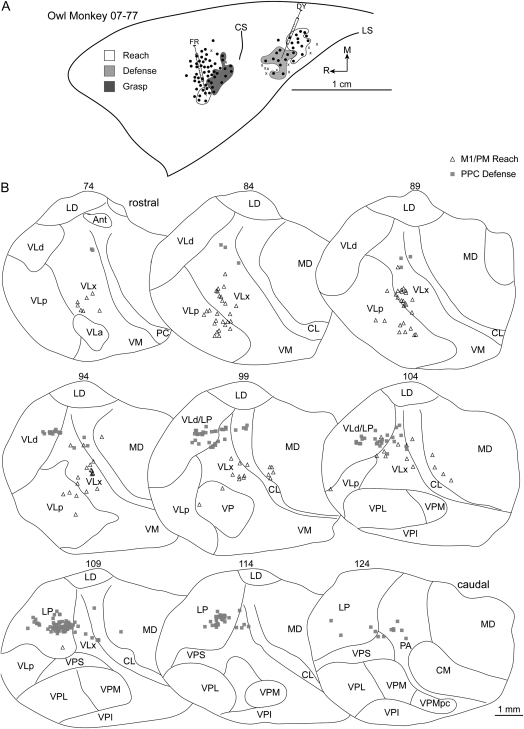
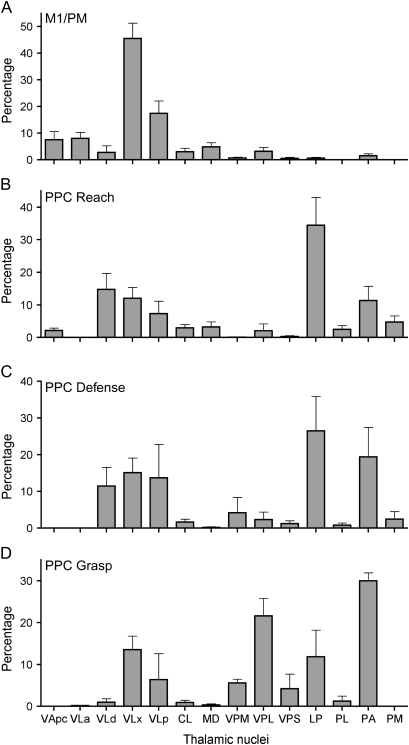
Posterior parietal cortex (PPC) links primate visual and motor systems and is central to visually guided action. Relating the anatomical connections of PPC to its neurophysiological functions may elucidate the organization of the parietal-frontal network. In owl and squirrel monkeys, long-duration electrical stimulation distinguished several functional zones within the PPC and motor/premotor cortex (M1/PM). Multijoint forelimb movements reminiscent of reach, defense, and grasp behaviors characterized each functional zone. In PPC, functional zones were organized parallel to the lateral sulcus. Thalamocortical connections of PPC and M1/PM zones were investigated with retrograde tracers. After several days of tracer transport, brains were processed, and labeled cells in thalamic nuclei were plotted. All PPC zones received dense inputs from the lateral posterior nucleus and the anterior pulvinar. PPC zones received additional projections from ventral lateral (VL) divisions of motor thalamus, which were also the primary source of input to M1/PM. Projections to PPC from rostral motor thalamus were sparse. Dense projections from ventral posterior (VP) nucleus of somatosensory thalamus distinguished the rostrolateral grasp zone from the other PPC zones. PPC connections with VL and VP provide links to cerebellar nuclei and the somatosensory system, respectively, that may integrate PPC functions with M1/PM.


Figures

Figure 1.
Figure 1.
Photomicrographs of coronal sections of owl monkey thalamus cut at 40 μm and stained for AChE. Representative sections were selected to show nuclei pertinent to cell labeling from tracers injections. Organization is from rostral (top) to caudal (bottom). Section numbers are in the bottom left corner of each panel. Scale bar = 1 mm.
Figure 2.
Figure 2.
Photomicrographs of tracer injection sites in the cortex (left panels) and examples of the corresponding cells labeled in the thalamus (right panels). Examples are from squirrel monkey case 08-09 shown in more detail in Figure 3. Sections of cortex were flattened and cut parallel to the surface at 40 μm. Photomicrographs were captured using a light microscope to show (A) CTB or using a fluorescent microscope to show (B) FB, (C) DY, and (D) FR. The inner outline marks the core of each tracer injection, whereas the surrounding outline marks a halo of intense tracer diffusion. Electrolytic lesions—delivered at the end of motor mapping to mark the boundaries of specific zones identified with electrical stimulation—are indicated with asterisks. The medial and lateral borders of the M1/PM grasp zone are marked with asterisks in (A). The caudomedial border of the PPC reach zone is marked in (B). The medial and lateral borders of PPC grasp zone are marked in (C). One-millimeter scale bar applies to all panels showing tracer injections. Cells labeled from corresponding injections to show (E) CTB-labeled cells in VLx, (F) FB-labeled cells in VLd/LP, (G) DY-labeled nuclei in VLx, (H) FR-labeled cells in VLx. Arrows point to examples of clearly labeled cells. Contrast was digitally enhanced for FR- and DY-labeled cells to improve illustration. Photomicrographs of labeled cells were captured from thalamic section 59 in Figure 3. Hundred-micrometer scale bar applies to all panels showing labeled cells.
Figure 3.
Figure 3.
(A) Map of multijoint forelimb movements evoked with intracortical electrical stimulation (0.2-ms biphasic current trains delivered at 300 Hz for 500 ms) from squirrel monkey case 08-09. Microelectrode penetration sites are color coded to reflect evoked movements. Sites that evoked dual movements are represented in 2 colors derived from the color code in the figure legend. Major functional zones are highlighted. M1/PM was mostly characterized by reach, defense, grasp/wrist supination zones, organized from caudal to rostral. The 3 zones shared borders. Rostral and medial to M1 was another reach zone. At the same rostral extent, but lateral, was another grasp zone that included sites of concurrent wrist supination or mouth opening. In PPC, zones of reach, defense, and grasp were organized in a caudomedial to rostrolateral progression. The defense zone involved forelimb movements, but aggressive face gesturers were evoked from the caudal half of this functional zone. Reach and defense zones were separated by sites that evoked forelimb-lift responses, whereas the defense and grasp zones were separated by sites that evoked forelimb supination, face movements, and unresponsive sites. Four retrograde tracers were injected: CTB into M1/PM grasp zone, FR into M1/PM near sites that evoked concurrent grasping and mouth opening, FB into PPC reach zone, and DY into the PPC grasp zone. Major landmarks include lateral sulcus (LS) and central sulcus (CS). (B) Distributions of labeled cells in a series of coronal thalamic sections from the same case. Sections were cut at 40 μm, and the ascending section numbers are organized from rostral to caudal. Each symbol represents a single cell labeled by 1 of the 4 retrograde tracers. Borders of thalamic nuclei were identified from architectonic analysis in adjacent sections.
Figure 4.
Figure 4.
(A) Map of multijoint forelimb movements evoked with intracortical electrical stimulation from squirrel monkey case 08-03. Four retrograde tracers were injected: FB into M1/PM defense zone, FR into M1/PM reach zone, CTB into PPC reach zone, and DY into PPC defense zone. (B) Distributions of labeled cells in a series of coronal thalamic sections from the same case. A brief survival period limited tracer transport for at least 3 injections. The adequate number of labeled cells from tracer injection in the PPC reach zone was likely due to rapid CTB transport. Borders of thalamic nuclei were identified from architectonic analysis in adjacent sections.
Figure 5.
Figure 5.
(A) Map of multijoint forelimb movements evoked with intracortical electrical stimulation from squirrel monkey case 07-118. Three retrograde tracers were injected: FB into M1/PM defense zone, DY into PPC forelimb-to-body representation, and CTB into PPC grasp zone. (B) Distributions of labeled cells in a series of coronal thalamic sections from the same case.
Figure 6.
Figure 6.
(A) Map of multijoint forelimb movements evoked with intracortical electrical stimulation from owl monkey case 08-45. Microelectrode penetration sites are color coded to reflect evoked movements. Sites that evoked dual movements are represented in 2 colors derived from the color code in the figure legend. Major functional zones are highlighted. M1/PM was primarily characterized by grasp, wrist supination, and defense zones. A reach zone was rostral and medial in M1/PM, whereas concurrent face and forelimb movements were evoked from the same approximate rostral extent but lateral. In PPC, reach, defense, and grasp zones were organized in a caudomedial to rostrolateral progression. Reach and defense zones bordered one another, whereas unresponsive sites separated the defense and grasp zones of PPC. Four retrograde tracers were injected: DY into M1/PM near sites that evoked concurrent defensive forelimb movements and aggressive face gestures, CTB into PPC reach zone, FB into PPC defense zone, FR into PPC grasp zone. (B) Distributions of labeled cells in a series of coronal thalamic sections (40 μm) from the same case. A limited number of cells were labeled from the PPC grasp zone because a small volume of FR was purposely injected to minimize tracer spread beyond this limited target zone.
Figure 7.
Figure 7.
(A) Map of multijoint forelimb movements evoked with intracortical electrical stimulation from owl monkey case 07-103. Four retrograde tracers were injected: FR into the M1/PM defense zone, DY into M1/PM near sites that evoked grasping and mouth opening, CTB into PPC reach zone, and FB into PPC defense zone. (B) Distributions of labeled cells in a series of coronal thalamic sections from the same case. A limited number of cells were labeled from the M1/PM defense zone injection likely because of a small injection volume of FR.
Figure 8.
Figure 8.
(A) Map of multijoint forelimb movements evoked with intracortical electrical stimulation from owl monkey case 07-85. Three retrograde tracers were injected: CTB into M1/PM grasp zone, FR into M1/PM reach zone, DY into the PPC reach zone. (B) Distributions of labeled cells in a series of coronal thalamic sections from the same case. A limited number of cells were labeled from the M1/PM reach zone injection likely due to a small injection volume of FR. Borders of thalamic nuclei were identified from architectonic analysis in adjacent sections.
Figure 9.
Figure 9.
(A) Map of multijoint forelimb movements evoked with intracortical electrical stimulation from owl monkey case 08-41. Three retrograde tracers were injected: FB into M1/PM reach zone, FR into PPC reach zone, and CTB into PPC defense zone. (B) Distributions of labeled cells in a series of coronal thalamic sections from the same case.
Figure 10.
Figure 10.
(A) Map of multijoint forelimb movements evoked with intracortical electrical stimulation from owl monkey case 07-77. Two retrograde tracers were injected: FR into M1/PM reach zone and DY into PPC defense zone. (B) Distributions of labeled cells in a series of coronal thalamic sections from the same case.
Figure 11.
Figure 11.
Histogram summaries of the distribution of cells labeled in thalamic nuclei from 3 squirrel monkeys and 5 owl monkeys. The mean percentage of labeled cells and corresponding standard errors of the mean were calculated from the distributions presented in Tables 1 and 2. The number of injections into each functional zone is listed in the same tables. Thalamic nuclei included in the histograms contained at least a mean of 2% of the labeled cells for any given functional zone.

Similar articles

Cited by

References

    1. Alder LD. Thalamic connectivity of rat somatic motor cortex. Brain Res Bull. 1988;20:333–348. - PubMed
    1. Alexander GE, DeLong MR, Strick PL. Parallel organization of functionally segregated circuits linking basal ganglia and cortex. Annu Rev Neurosci. 1986;9:357–381. - PubMed
    1. Asanuma H, Rosen I. Topographical organization of cortical efferent zones projecting to distal forelimb muscles in the monkey. Exp Brain Res. 1972;14:243–256. - PubMed
    1. Battaglia-Mayer A, Ferraina S, Mitsuda T, Marconi B, Genovesio A, Onorati P, Lacquaniti F, Caminiti R. Early coding of reaching in the parietooccipital cortex. J Neurophys. 2000;83:2374–2391. - PubMed
    1. Cappe C, Morel A, Rouiller EM. Thalamocortical and the dual pattern of corticothalamic projections of the posterior parietal cortex in macaque monkeys. Neuroscience. 2007;146:1371–1387. - PubMed

Publication types

MeSH terms