

doi: 10.1101/gad.1878510.
Epub 2010 Jan 15.
Role of the hypothalamic-pituitary-thyroid axis in metabolic regulation by JNK1
Affiliations
- PMID: 20080940
- PMCID: PMC2811827
- DOI: 10.1101/gad.1878510
Item in Clipboard
Role of the hypothalamic-pituitary-thyroid axis in metabolic regulation by JNK1
Genes Dev.
.
Abstract
The cJun N-terminal kinase 1 (JNK1) is implicated in diet-induced obesity. Indeed, germline ablation of the murine Jnk1 gene prevents diet-induced obesity. Here we demonstrate that selective deficiency of JNK1 in the murine nervous system is sufficient to suppress diet-induced obesity. The failure to increase body mass is mediated, in part, by increased energy expenditure that is associated with activation of the hypothalamic-pituitary-thyroid axis. Disruption of thyroid hormone function prevents the effects of nervous system JNK1 deficiency on body mass. These data demonstrate that the hypothalamic-pituitary-thyroid axis represents an important target of metabolic signaling by JNK1.
Figures
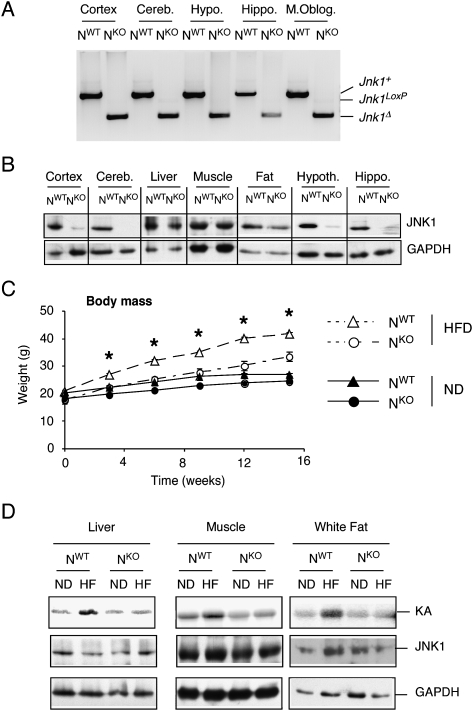
Creation of mice with nervous system-specific JNK1 deficiency. (A) Genotype analysis of genomic DNA isolated from the cortex, cerebellum (Cereb.), hippocampus (Hippo.), hypothalamus (Hypoth.), and medulla oblongata (M. Oblog.) of Nes-Cre+ Jnk1+/+ (NWT) mice and Nes-Cre+ Jnk1LoxP/LoxP (NKO) mice was performed to detect the presence of Jnk1+, Jnk1LoxP, and Jnk1Δ alleles. (B) Extracts prepared from the cortex, cerebellum, liver, muscle (quadriceps), fat (epididymal adipose tissue), hypothalamus, and hippocampus of NWT and NKO mice were examined using immunoblot analysis by probing with antibodies to JNK1 and GAPDH. (C) NWT and NKO male mice (8–10 wk old) were fed either a chow diet (ND) or a HFD (16 wk). The weight of the mice was measured (mean ± SD; n = 10). The HFD-induced weight gain of NWT was significantly greater than NKO mice (P < 0.05). (D) NWT and NKO mice were fed a chow diet (ND) or a HFD for 16 wk. JNK activity in the liver, quadriceps muscle, and epididymal adipose tissue was measured in a protein kinase assay (KA) assay using cJun and [γ-32P]ATP as substrates. The cell extracts used for the protein kinase assay were also examined by immunoblot analysis by probing with antibodies to JNK1 and GAPDH.
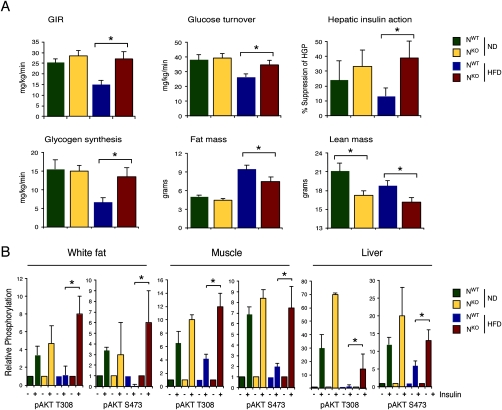
Effect of nervous system-specific JNK1 deficiency on insulin sensitivity. (A) Insulin sensitivity was measured using a hyperinsulinemic–euglycemic clamp in conscious NKO and NWT mice. The steady-state glucose infusion rate (GIR), whole-body glucose turnover, hepatic insulin action, and whole-body glycogen plus lipid synthesis are presented. Fat and lean body mass were measured by 1H-MRS. The data presented are the mean ± SE for six to approximately eight experiments. Statistically significant differences between NKO mice and NWT mice are indicated ([*] P < 0.05). (B) Chow-fed (ND) and HFD-fed NWT and NKO mice were treated by intraperitoneal injection of insulin (1.5 U/kg body mass). Extracts prepared from epididymal adipose tissue, quadriceps muscle, and liver at 15 min post-injection were examined by immunoblot analysis with antibodies to phospho-AKT (Thr-308 and Ser-473) and AKT. Quantitation was performed using the Odyssey infrared imaging system (LI-COR Biosciences). The data presented are the mean ± SD (n = 3). Statistically significant differences between NKO mice and NWT mice are indicated ([*] P < 0.05).
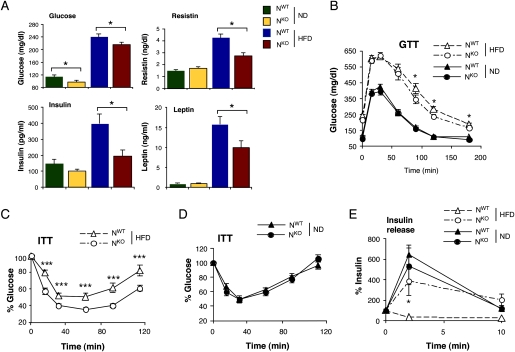
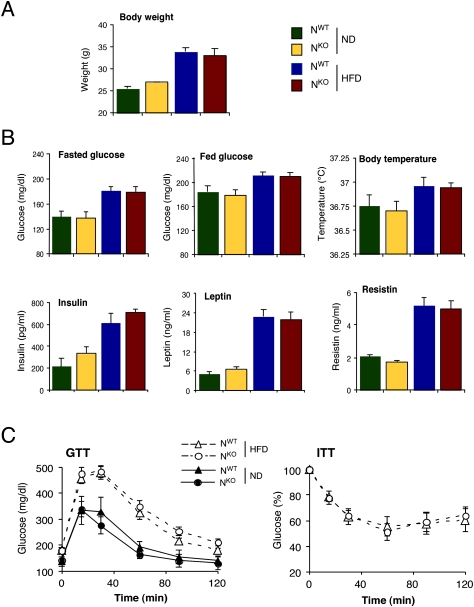
JNK1 deficiency in the nervous system partially protects mice against the metabolic effects of feeding a HFD. (A) Blood glucose concentration in chow-fed (ND) and HFD-fed NWT and NKO mice fasted overnight. The blood concentration of insulin, resistin, and leptin in mice fasted overnight is also presented. The data represent the mean ± SD (n = 10). Statistically significant differences between NKO and NWT are indicated ([*] P < 0.05). (B) Glucose tolerance tests (GTT) on chow-fed (ND) and HFD-fed NWT and NKO mice were performed by measurement of blood glucose concentration in animals following intraperitoneal injection of glucose (1 g/kg). The data presented represent the mean ± SD (n = 10∼15). Statistically significant differences between NKO and NWT are indicated ([*] P < 0.05). (C,D) Insulin tolerance tests (ITT) on NWT and NKO mice fed either a chow diet (ND) or a HFD were performed by intraperitoneal injection of insulin (1.5 U/kg body mass). The concentration of blood glucose was measured (mean ± SD; n = 10). Statistically significant differences between NKO and NWT are indicated ([***] P < 0.001). (E) Glucose-induced insulin release. The effect of administration of glucose (2 g/kg body mass) by intraperitoneal injection on blood insulin concentration was examined (mean ± SD; n = 13∼15). Statistically significant differences between NWT and NKO mice are indicated ([*] P < 0.05).
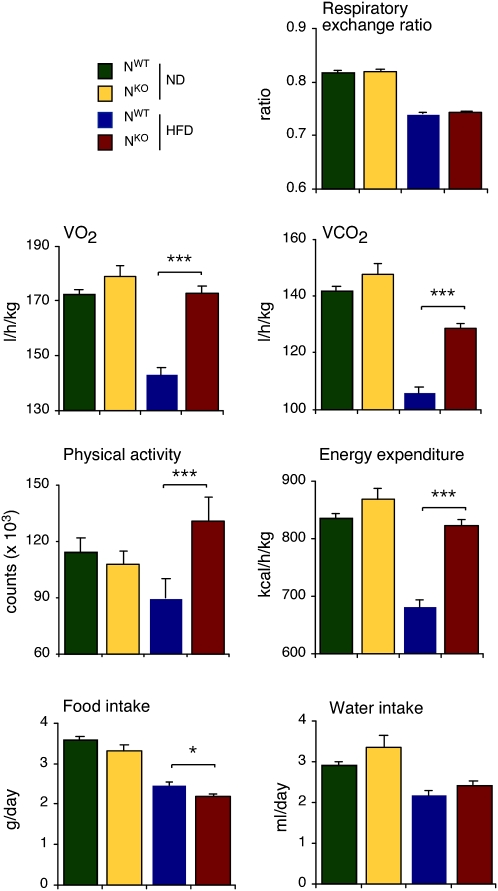
Comparison of energy balance of NWT and NKO mice using metabolic cages. Mice were examined during a 3-d period to measure the food and water consumption, gas exchange (VO2 and VCO2), respiratory exchange quotient [VCO2]/[VO2 ], energy expenditure, and physical activity (mean ± SE, n = 6). Statistically significant differences between NKO mice and NWT mice are indicated ([*] P < 0.05; [**] P < 0.01; [***] P < 0.001).
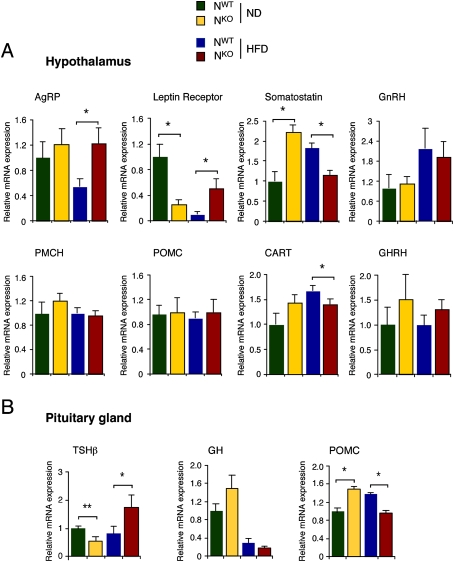
Gene expression in the hypothalamus and pituitary gland of NWT and NKO mice. (A) NWT and NKO mice were fed a chow diet (ND) or a HFD (16 wk) and then fasted overnight. The expression of AgRP, leptin receptor, somatostatin, gonadotrophin-releasing hormone (GnRH), PMCH, POMC, CART, and GH-releasing hormone (GHRH) mRNA in the hypothalamus was measured by quantitative RT–PCR. The data were normalized to the expression of Gapdh mRNA in each sample. The data are presented as the mean ± SD (n = 6). Statistically significant differences between NWT and NKO mice are indicated ([*] P < 0.05). (B) The expression of TSHβ, GH, and POMC mRNA in the pituitary gland was measured by quantitative RT–PCR. The data were normalized to the expression of Gapdh mRNA in each sample. The data are presented as the mean ± SD (n = 6). Statistically significant differences between NWT and NKO mice are indicated ([*] P < 0.05; [**] P < 0.01).
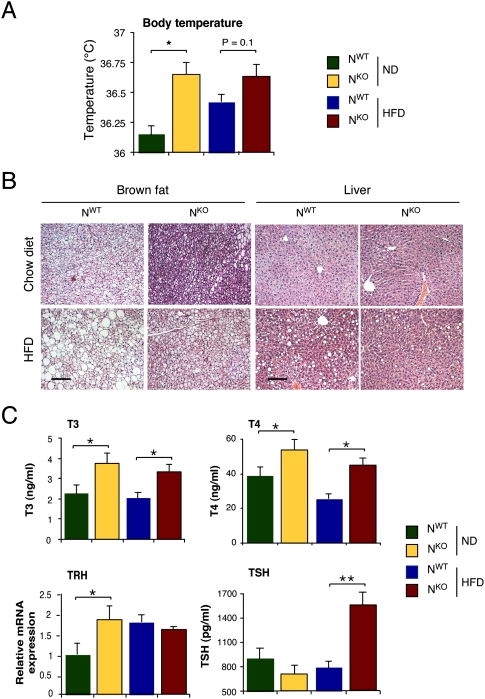
Activation of the hypothalamic–pituitary–thyroid hormone axis in NKO mice. (A) The body temperature of chow-fed (ND) and HFD-fed NKO and NWT mice are presented (mean ± SD; n = 8). Statistically significant differences between NKO and NWT mice are indicated ([*] P < 0.05). (B) Sections prepared from intrascapular brown fat and liver of chow-fed (ND) and HFD-fed NKO and NWT mice were stained with hematoxylin and eosin. Bar, 100 μm. (C) The concentration of T3, T4, and TSH in the blood of chow-fed (ND) and HFD-fed NKO and NWT mice was measured by ELISA (mean ± SD, n = 10). The amount of Trh mRNA in the hypothalamus was measured by quantitative RT–PCR analysis and was normalized to the amount of Gapdh mRNA measured in each sample (mean ± SD; n = 6∼7). Statistically significant differences between NKO and NWT mice are indicated ([*] P < 0.05; [**] P < 0.01).
Disruption of thyroid hormone signaling prevents the effects of nervous system-specific JNK1 deficiency on HFD-induced weight gain. (A) NKO and NWT mice were treated with PTU in the drinking water. The mice were divided into chow-fed (ND) and HFD-fed groups after 2 wk, and then maintained for an additional 10 wk. The body weight of the mice is presented. No statistically significant differences between NKO and NWT mice were detected (P > 0.05). (B) Chow-fed (ND) and HFD-fed NKO and NWT mice were examined after 12 wk of treatment with PTU. The blood glucose concentration in fed and overnight fasted mice, body temperature, and the blood hormone (insulin, leptin, and resistin) concentrations are presented. No significant differences between NKO and NWT mice were detected (P > 0.05). (C) Glucose tolerance tests (GTT) on PTU-treated chow-fed (ND) and HFD-fed NKO and NWT mice are presented. No significant differences between NKO and NWT mice were detected (P > 0.05). Insulin tolerance tests (ITT) on PTU-treated HFD-fed NKO and NWT mice are presented. No significant differences between NKO and NWT mice were detected (P > 0.05).
References
-
- Aguirre V, Uchida T, Yenush L, Davis R, White MF. The c-Jun NH2-terminal kinase promotes insulin resistance during association with insulin receptor substrate-1 and phosphorylation of Ser(307) J Biol Chem. 2000;275:9047–9054. - PubMed
-
- Bennett BL, Satoh Y, Lewis AJ. JNK: A new therapeutic target for diabetes. Curr Opin Pharmacol. 2003;3:420–425. - PubMed
-
- Björkman U, Ekholm R. Biochemistry of thyroid hormone formation and secretion. In: Greer MA, editor. The thyroid gland. Raven Press; New York: 2000. pp. 83–125.
-
- Dong C, Yang DD, Wysk M, Whitmarsh AJ, Davis RJ, Flavell RA. Defective T cell differentiation in the absence of Jnk1. Science. 1998;282:2092–2095. - PubMed
Publication types
MeSH terms
Substances
Grants and funding
LinkOut - more resources
Full Text Sources
Molecular Biology Databases
Research Materials
Miscellaneous