. 2010 Apr;333(1):297-309.
doi: 10.1124/jpet.109.164277. Epub 2010 Jan 15.

Muscarinic receptor stimulation of D-aspartate uptake into human SH-SY5Y neuroblastoma cells is attenuated by hypoosmolarity

Affiliations

Muscarinic receptor stimulation of D-aspartate uptake into human SH-SY5Y neuroblastoma cells is attenuated by hypoosmolarity

Daniel J Foster et al. J Pharmacol Exp Ther. 2010 Apr.

Abstract

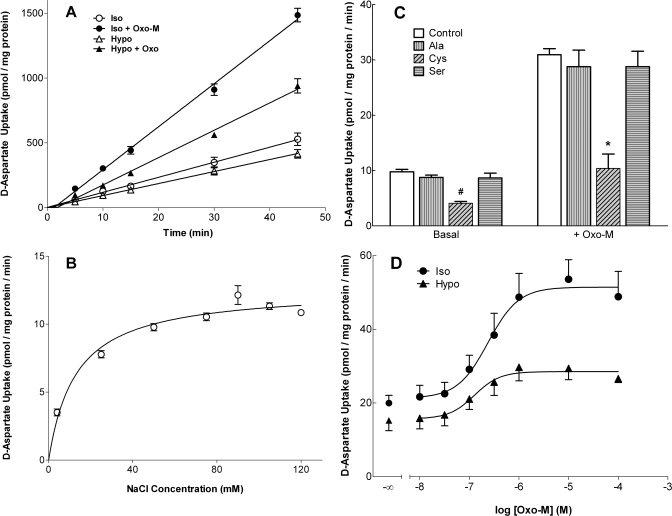
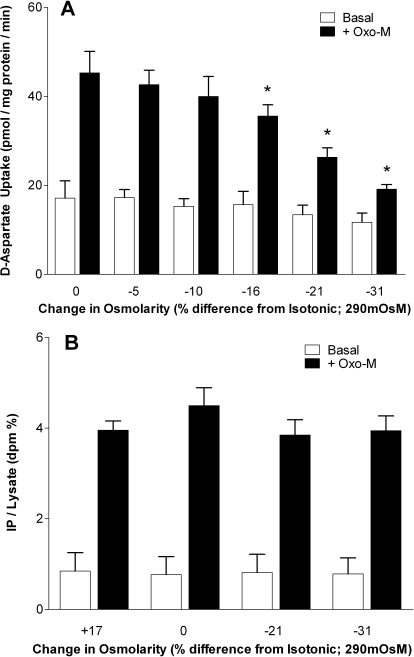
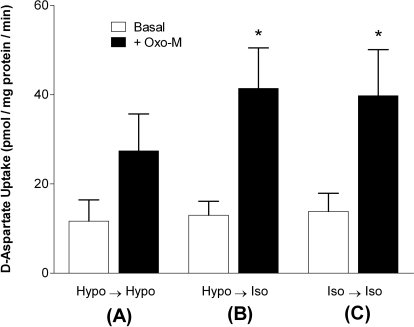
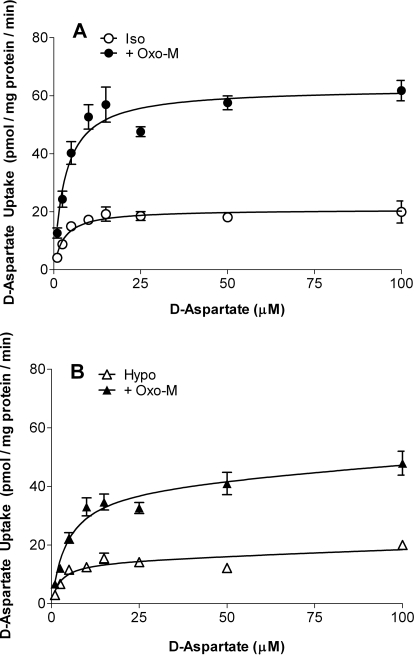
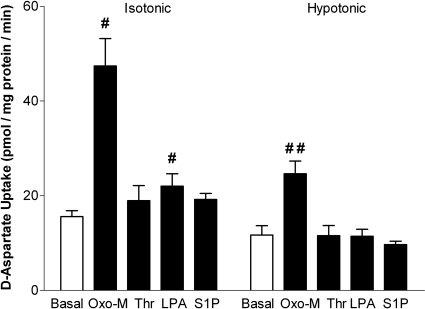
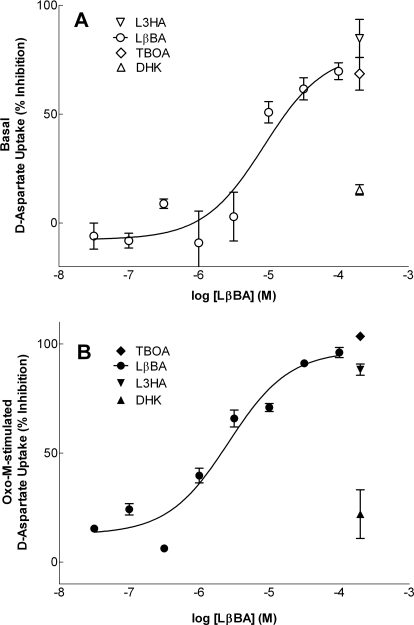
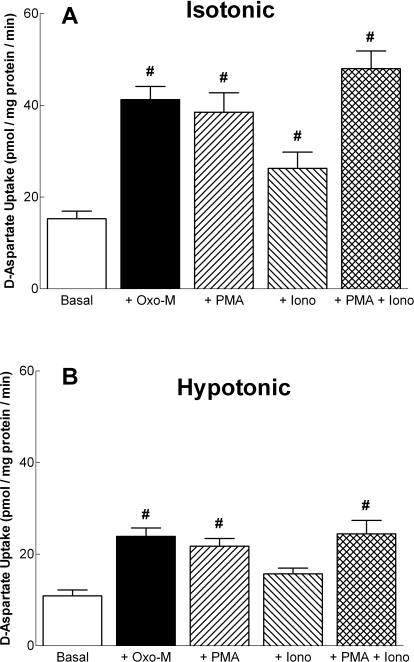
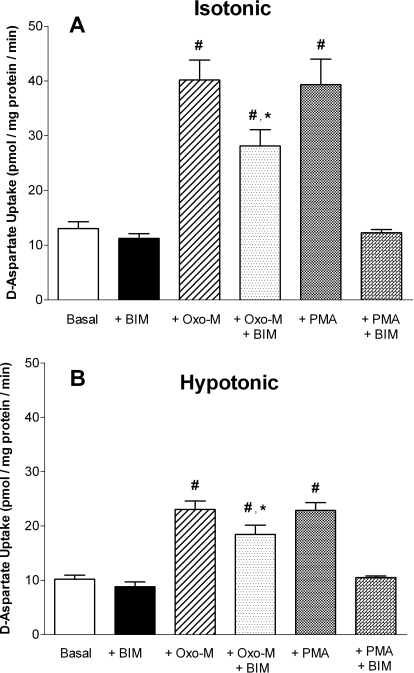
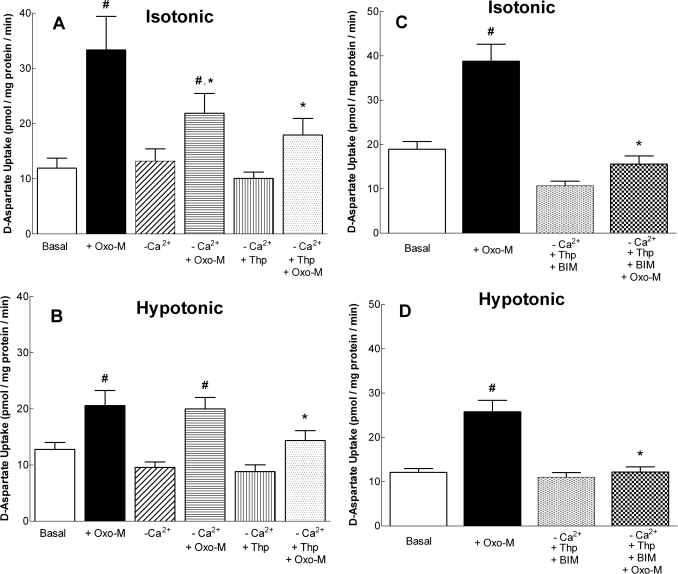
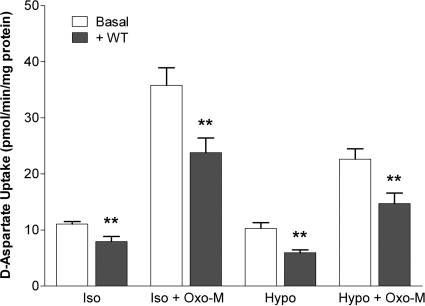
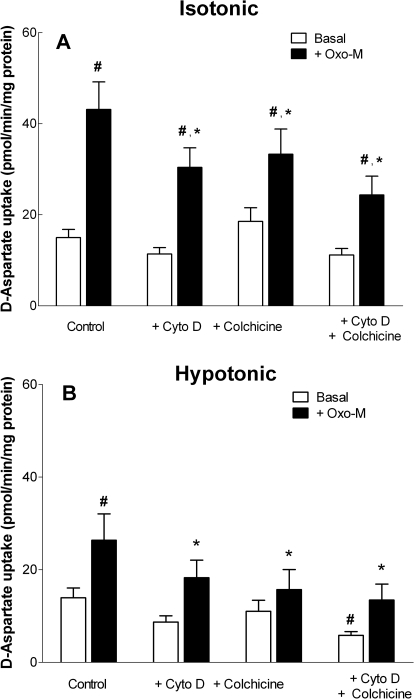
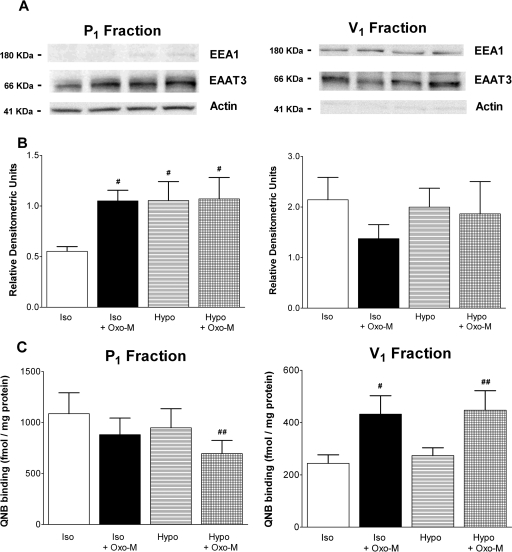
In addition to its function as an excitatory neurotransmitter, glutamate plays a major role as an osmolyte within the central nervous system (CNS). Accordingly, mechanisms that regulate glutamate release and uptake are of physiological importance not only during conditions in which cell volume remains constant but also when cells are subjected to hypoosmotic stress. In the present study, the ability of muscarinic cholinergic receptors (mAChRs) to regulate the uptake of glutamate (monitored as D-aspartate) into human SH-SY5Y neuroblastoma cells under isotonic or hypotonic conditions has been examined. In isotonic media, agonist activation of mAChRs resulted in a significant increase (250-300% of control) in the uptake of D-aspartate and, concurrently, a cellular redistribution of the excitatory amino acid transporter 3 (EAAT3) to the plasma membrane. mAChR-mediated increases in d-aspartate uptake were potently blocked by the EAAT3 inhibitor l-beta-threo-benzyl-aspartate. In hypotonic media, the ability of mAChR activation to facilitate D-aspartate uptake was significantly attenuated (40-50%), and the cellular distribution of EAAT3 was disrupted. Reduction of mAChR-stimulated D-aspartate uptake under hypoosmotic conditions could be fully reversed upon re-exposure of the cells to isotonic media. Under both isotonic and hypotonic conditions, mAChR-mediated increases in D-aspartate uptake depended on cytoskeletal integrity, protein kinase C and phosphatidylinositol 3-kinase activities, and the availability of intracellular Ca2+. In contrast, dependence on extracellular Ca2+ was observed only under isotonic conditions. The results suggest that, although the uptake of D-aspartate into SH-SY5Y cells is enhanced after mAChR activation, this process is markedly attenuated by hypoosmolarity.


Figures

Fig. 1.
Fig. 1.
Characteristics of basal- and Oxo-M-stimulated d-aspartate uptake in SH-SY5Y cells under isotonic and hypotonic conditions. A, time course. Cells were incubated in 5 ml of isotonic buffer (Iso; 290 mOsM) in the absence (○) or presence (●) of 100 μM Oxo-M or hypotonic buffer (Hypo; 230 mOsM corresponding to a 21% reduction in OsM) with (▴) or without (▵) addition of Oxo-M. All incubations contained 0.3 μCi/ml [3H]aspartate and 10 μM unlabeled aspartate; reactions were terminated at the times indicated, and [3H]aspartate uptake was monitored. Results are expressed as d-aspartate uptake (pmol/mg protein) and are the means ± S.E.M. of three independent experiments, each performed in duplicate. Where error bars are absent the S.E.M. fell within the symbol. Rates of d-aspartate influx were calculated from linear regression analyses of the data. B, NaCl dependence. Cells were incubated for 45 min in the presence of NaCl at the concentrations indicated, and basal uptake of d-aspartate was monitored. Where NaCl is reduced, sucrose was substituted to maintain isotonicity. Results are expressed as d-aspartate uptake (pmol/mg protein/min) and are the means ± S.E.M. for three independent experiments. C, cells were incubated under isotonic conditions for 45 min in the absence or presence of Oxo-M (100 μM) with 100 μM concentrations of l-cysteine (l-Cys), l-serine (l-Ser), or l-alanine (l-Ala). Results are expressed as d-aspartate uptake (pmol/mg protein/min) and are means ± S.E.M. for three independent experiments. p < 0.05 different from d-aspartate uptake measured under control conditions in the absence (#) or presence (*) of Oxo-M (by repeated measures ANOVA with a post hoc Bonferroni multiple comparisons test). D, dose-response relationship for Oxo-M-mediated stimulation of d-aspartate uptake under isotonic (●) or hypotonic (▴) conditions (290 and 230 mOsM, respectively). Reactions were terminated after 10 min, and d-aspartate uptake was monitored. Results are expressed as d-aspartate uptake (pmol/mg protein/min) and are the means ± S.E.M. for three independent experiments.
Fig. 2.
Fig. 2.
Effect of osmolarity on d-aspartate uptake and mAChR signaling. A, cells were incubated in buffers of the osmolarity indicated (isotonic buffer = 290 mOsM) in either the absence (open bars) or presence (closed bars) of 100 μM Oxo-M. The osmolarity of the buffers was adjusted under conditions of a fixed NaCl concentration (90 mM) by the addition of sucrose. Reactions were terminated after 10 min, and d-aspartate uptake was monitored. Results are expressed as d-aspartate uptake (pmol/mg protein/min) and are the means ± S.E.M. of four independent experiments, each performed in duplicate. *, p < 0.05 different from d-aspartate uptake measured under isotonic conditions (290 mOsm) in the presence of Oxo-M (by repeated measures ANOVA followed by a Bonferroni multiple comparisons test). B, cells that had been prelabeled for 48 h with [3H]inositol were treated for 10 min in buffers of the osmolarity indicated in either the absence (open bars) or presence (closed bars) of 100 μM Oxo-M. Reactions were terminated by the addition of trichloroacetic acid, and the accumulation of radiolabeled inositol phosphates (IP) was monitored as an index of stimulated phosphoinositide turnover. Results are expressed as inositol phosphate (IP) released/total soluble radioactivity in cell lysates (IP/lysate; dpm %) and are the means ± S.E.M. for three independent experiments, each performed in triplicate.
Fig. 3.
Fig. 3.
Reversibility of osmolarity-mediated inhibition of d-aspartate uptake. Cells were first preincubated for 10 min in either hypotonic buffer (Hypo; 230 mOsM, conditions A and B) or isotonic buffer (Iso; 290 mOsM, condition C) in the presence or absence of 100 μM Oxo-M. Cells were then washed twice with 2 ml of buffer (osmolarity of wash buffer matched to that of the pretreatment buffer) and incubated with 10 μM [3H]d-aspartate for an additional 20 min in 5 ml of either hypotonic (condition A) or isotonic buffers (conditions B and C) in the presence (closed bars) or absence (open bars) of Oxo-M (100 μM). Results are expressed as d-aspartate uptake (pmol/mg protein/min) and are the means ± S.E.M. of four independent experiments, each performed in triplicate. *, p < 0.05 different from d-aspartate uptake measured under condition A in the presence of Oxo-M (by repeated measures ANOVA followed by a Bonferroni multiple comparisons test).
Fig. 4.
Fig. 4.
Substrate concentration dependence of d-aspartate uptake. SH-SY5Y cells were incubated in either isotonic (Iso; 290 mOsM) (A) or hypotonic (Hypo; 230 mOsM) (B) buffer in the absence (open symbols) or presence (closed symbols) of 100 μM Oxo-M at the d-aspartate concentrations indicated. Reactions were terminated after 10 min, and d-aspartate uptake was determined. Results are the means ± S.E.M. of four independent experiments, each performed in duplicate. Where error bars are absent, the S.E.M. fell within the symbol. Kinetic parameters were obtained from eq. 1, as described under Materials and Methods.
Fig. 5.
Fig. 5.
Agonist-mediated increases in d-aspartate uptake are receptor-specific. Cells were incubated under either isotonic (290 mOsM) or hypotonic (230 mOsM) conditions in the absence or presence of 100 μM Oxo-M, 1.25 nM thrombin (Thr), 5 μM S1P, or 10 μM LPA. Reactions were terminated after 10 min, and d-aspartate uptake was monitored. Results are the means ± S.E.M. of four independent experiments, each performed in duplicate. p < 0.05 different from d-aspartate uptake observed under isotonic (#) or hypotonic (##) basal conditions (by repeated measures ANOVA followed by a Bonferroni multiple comparisons test).
Fig. 6.
Fig. 6.
Effect of EAAT inhibitors on basal- and Oxo-M-stimulated d-aspartate uptake. Cells were incubated in isotonic buffer (290 mOsM) in the absence (A) or presence (B) of 100 μM Oxo-M with or without the EAAT inhibitors TBOA, LβBA, L3HA, or DHK at the concentrations indicated. Reactions were terminated after 10 min, and results are presented as percentage inhibition of basal d-aspartate uptake (A) or percentage inhibition of Oxo-M-stimulated d-aspartate uptake (B) and are the means ± S.E.M. of three to six independent experiments, each performed in duplicate. LβBA inhibited basal d-aspartate uptake with an IC50 of 8.6 μM and attenuated Oxo-M-stimulated d-aspartate uptake with an IC50 of 2.6 μM.
Fig. 7.
Fig. 7.
Agents that either activate PKC or increase intracellular Ca2+ concentrations mimic the ability of Oxo-M to induce d-aspartate uptake. d-Aspartate uptake was monitored in SH-SY5Y cells after 10 min of incubation under isotonic (290 mOsM) (A) or hypotonic (230 mOsM) (B) conditions in the absence or presence of 100 μM Oxo-M, 100 nM PMA, or 1 μM ionomycin (Iono). Results shown are the means ± S.E.M. of three to four independent experiments, each performed in duplicate. #, p < 0.05 different from d-aspartate uptake observed under basal conditions (by repeated measures ANOVA followed by Dunnett's multiple comparisons test).
Fig. 8.
Fig. 8.
Inhibition of PKC attenuates both Oxo-M- and PMA-stimulated d-aspartate uptake. Cells were incubated under either isotonic (290 mOsM) (A) or hypotonic (230 mOsM) (B) conditions in the absence or presence of 100 μM Oxo-M, 100 nM PMA, or 2.5 μM BIM, as indicated. All cells treated with BIM received a 10-min pretreatment in isotonic (290 mOsM) buffer containing 2.5 μM BIM. Reactions were terminated after 10 min, and results are expressed as d-aspartate uptake (pmol/min/mg protein) and are the means ± S.E.M. of three independent experiments, each performed in duplicate. p < 0.05 different from d-aspartate uptake observed under basal (#) or Oxo-M-treated (*) conditions (by repeated measures ANOVA followed by a Bonferroni multiple comparisons test).
Fig. 9.
Fig. 9.
The role of extracellular and intracellular Ca2+ in Oxo-M-stimulated d-aspartate uptake. A and B, cells were incubated under either isotonic (290 mOsM) (A) or hypotonic (230 mOsM) (B) conditions in the absence (−Ca2+; Ca2+ was omitted from buffer and 50 μM EGTA was added) or the presence of extracellular Ca2+ with or without the addition of 100 μM Oxo-M. Some cells were preincubated for 15 min in isotonic buffer containing 1 μM thapsigargin (Thp) to deplete intracellular pools of Ca2+ before measurement of d-aspartate uptake in either the absence or presence of Oxo-M. Reactions were terminated after 10 min, and d-aspartate uptake was determined. C and D, cells were preincubated for 15 min with 2.5 μM BIM and 1 μM Thp (−Ca2+) and then incubated under isotonic or hypotonic conditions in the absence or presence of Oxo-M. Results shown are the means ± S.E.M. of four independent experiments, each performed in duplicate. p < 0.05 different from d-aspartate uptake observed either under basal conditions (#) or in the presence of Oxo-M alone (*) (by repeated measures ANOVA followed by a Bonferroni multiple comparisons test).
Fig. 10.
Fig. 10.
Inhibition of PI3K with wortmannin inhibits both basal- and Oxo-M-stimulated d-aspartate uptake. Cells were incubated in either isotonic (Iso; 290 mOsM) or hypotonic (Hypo; 230 mOsM) buffer in the absence or presence of 100 μM Oxo-M and 100 nM wortmannin (WT). d-Aspartate uptake was monitored after 10 min. Results shown are the means ± S.E.M. of four independent experiments, each performed in duplicate. **, p < 0.05 different from d-aspartate uptake observed in the absence of WT (by paired Student's t test).
Fig. 11.
Fig. 11.
Disruption of the cytoskeleton attenuates Oxo-M-stimulated d-aspartate uptake. Cells were incubated under either isotonic (290 mOsM) (A) or hypotonic (230 mOsM) (B) conditions in the presence or absence of 100 μM Oxo-M, 1 μM Cyto D, or 10 μM colchicine for 10 min, and d-aspartate uptake was determined. All cells treated with Cyto D and/or colchicine were exposed to the drugs for 30 min in isotonic buffer before measurement of d-aspartate uptake. Results shown are the means ± S.E.M. of three independent experiments, each performed in duplicate. p < 0.05 different from d-aspartate uptake observed under control conditions in the absence (#) or presence (*) of Oxo-M (by repeated measures ANOVA followed by a Bonferroni multiple comparisons test).
Fig. 12.
Fig. 12.
Western blot analysis of EAAT3 in subcellular fractions derived from SH-SY5Y cells incubated in the absence or presence of Oxo-M. Cells were treated for 10 min in the presence of either isotonic (Iso; 290 mOsM) or hypotonic (Hypo; 230 mOsM) buffer in the absence or presence of 100 μM Oxo-M. Cells were then lysed and fractionated as described under Materials and Methods. A, equivalent aliquots (30 μg of protein) of subcellular fractions P1 (crude plasma membrane fraction) and V1 (“light” membrane fraction) were electrophoresed and transferred to nitrocellulose membranes. Membranes were then blotted for EAAT3, actin, and early endosomal antigen 1 (EAA1) as detailed under Materials and Methods. Blots shown are representative of those obtained in five independent experiments. B, densitometric analysis of Western blots. Results shown are the density of each fraction divided by the appropriate loading control (actin for P1; EAA1 for V1; means ± S.E.M. of five independent experiments). #, p < 0.05 different from density observed under basal isotonic conditions (by repeated measures ANOVA followed by a Bonferroni multiple comparisons test). C, [3H]QNB binding in P1 and V1 fractions derived from SH-SY5Y cells treated under isotonic or hypotonic conditions in the absence or presence of Oxo-M. Results shown are the means ± S.E.M. of five independent experiments and are expressed as fmol bound/mg of protein. p < 0.05 different from receptor density observed in the absence of Oxo-M under isotonic (#) or hypotonic (##) conditions (by repeated measures ANOVA followed by a Bonferoni multiple comparisons test).

Similar articles

Cited by

References

    1. Aoyama K, Suh SW, Hamby AM, Liu J, Chan WY, Chen Y, Swanson RA. (2006) Neuronal glutathione deficiency and age-dependent neurodegeneration in the EAAC1-deficient mouse. Nat Neurosci 9:119–126 - PubMed
    1. Beart PM, O'Shea RD. (2007) Transporters for l-glutamate: an update on their molecular pharmacology and pathological involvement. Br J Pharmacol 150:5–17 - PMC - PubMed
    1. Bertorello AM, Sznajder JI. (2005) The dopamine paradox in lung and kidney epithelia: sharing the same target but operating different signaling networks. Am J Respir Cell Mol Biol 33:432–437 - PMC - PubMed
    1. Bhardwaj A. (2006) Neurological impact of vasopressin dysregulation and hyponatremia. Ann Neurol 59:229–236 - PubMed
    1. Bianchi MG, Rotoli BM, Dall'Asta V, Gazzola GC, Gatti R, Bussolati O. (2006) PKC-dependent stimulation of EAAT3 glutamate transporter does not require the integrity of actin cytoskeleton. Neurochem Int 48:341–349 - PubMed

Publication types

LinkOut - more resources