. 2010 Mar 19;285(12):8840-54.
doi: 10.1074/jbc.M109.053934. Epub 2010 Jan 15.

Distal histidine stabilizes bound O2 and acts as a gate for ligand entry in both subunits of adult human hemoglobin

Affiliations

Distal histidine stabilizes bound O2 and acts as a gate for ligand entry in both subunits of adult human hemoglobin

Ivan Birukou et al. J Biol Chem. .

Abstract

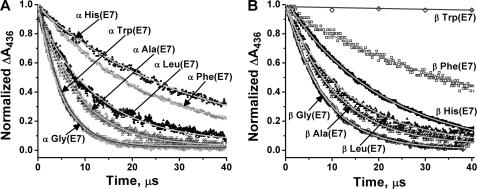
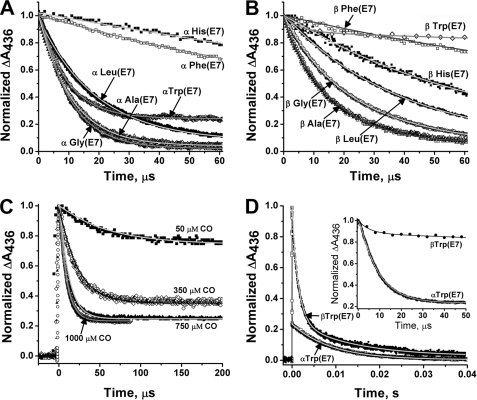
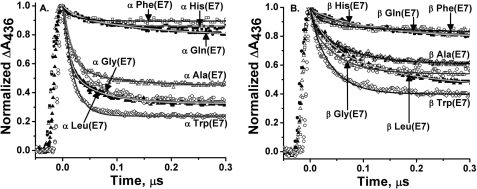
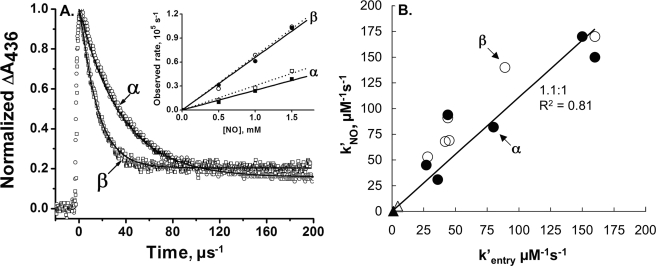
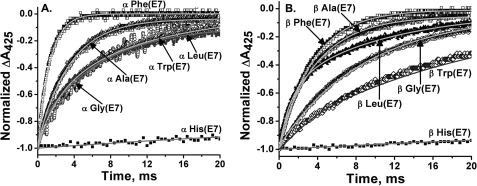
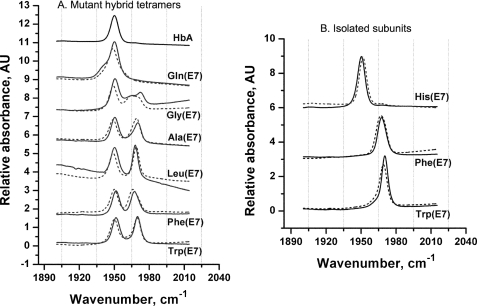
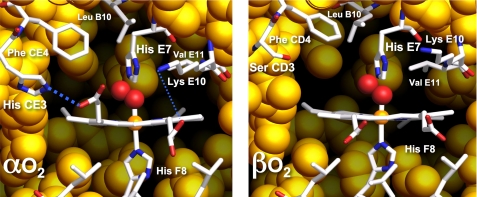
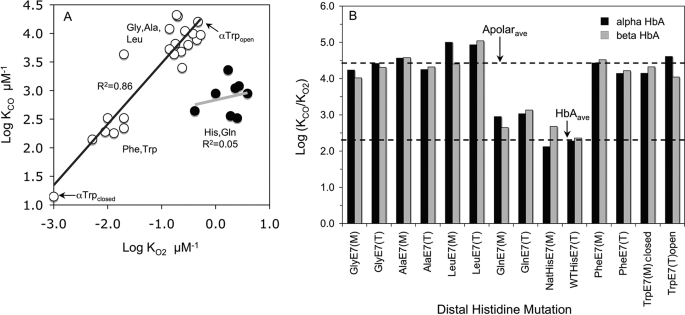
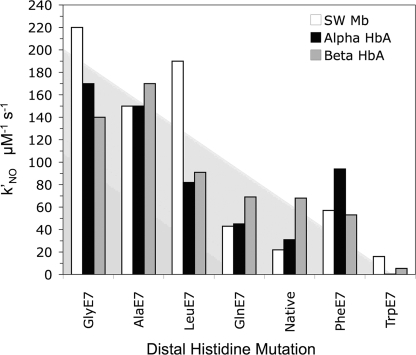
The role of the distal histidine in regulating ligand binding to adult human hemoglobin (HbA) was re-examined systematically by preparing His(E7) to Gly, Ala, Leu, Gln, Phe, and Trp mutants of both Hb subunits. Rate constants for O(2), CO, and NO binding were measured using rapid mixing and laser photolysis experiments designed to minimize autoxidation of the unstable apolar E7 mutants. Replacing His(E7) with Gly, Ala, Leu, or Phe causes 20-500-fold increases in the rates of O(2) dissociation from either Hb subunit, demonstrating unambiguously that the native His(E7) imidazole side chain forms a strong hydrogen bond with bound O(2) in both the alpha and beta chains (DeltaG(His(E7)H-bond) approximately -8 kJ/mol). As the size of the E7 amino acid is increased from Gly to Phe, decreases in k(O2)', k(NO)', and calculated bimolecular rates of CO entry (k(entry)') are observed. Replacing His(E7) with Trp causes further decreases in k(O2)', k(NO)', and k(entry)' to 1-2 microM(-1) s(-1) in beta subunits, whereas ligand rebinding to alphaTrp(E7) subunits after photolysis is markedly biphasic, with fast k(O2)', k(CO)', and k(NO)' values approximately 150 microM(-1) s(-1) and slow rate constants approximately 0.1 to 1 microM(-1) s(-1). Rapid bimolecular rebinding to an open alpha subunit conformation occurs immediately after photolysis of the alphaTrp(E7) mutant at high ligand concentrations. However, at equilibrium the closed alphaTrp(E7) side chain inhibits the rate of ligand binding >200-fold. These data suggest strongly that the E7 side chain functions as a gate for ligand entry in both HbA subunits.


Figures

SCHEME 1.
SCHEME 1.
FIGURE 1.
FIGURE 1.
Time courses for O2 binding to and displacement from isolated human Ala(E7) αCO subunits at pH 7. 4, 20 °C. A, reactions were carried out in buffers equilibrated with 1 atm of O2 and air, and no free CO, until after photolysis of the αCO sample. The time courses were fitted to single exponential expressions with an offset representing the 1,000-fold slower CO replacement reaction. B, time courses for the slower replacement reaction measured at 425 nm at 4 different [O2]/[CO] ratios. The amplitude of the slow phase decreases as [CO]/[O2] increases because CO begins to compete with O2 in the initial association reaction. C, dependence of the observed replacement rate on [CO]/[O2] and fits to Equation 2.
SCHEME 2.
SCHEME 2.
SCHEME 3.
SCHEME 3.
FIGURE 2.
FIGURE 2.
Bimolecular binding of O2 to native and E7 mutants of isolated α and β subunits of recombinant human HbA. In these experiments, ∼50 μm HbCO was photolyzed with a 0.5-μs dye laser excitation pulse in a mixture of 625 μm O2 and 500 μm CO in 0.1 m phosphate buffer, pH 7.0, or 50 mm HEPES, 0.1 m NaCl, 0.1 mm EDTA, pH 7.4, 20 °C (no differences were observed between these conditions for isolated subunits and R state tetramers in partial photolysis or replacement experiments). Under these conditions, the observed first order rate constant, kobs, equals kO2′[O2] + kO2 + kCO′ [CO] and, in most cases, is dominated by O2 binding. Bimolecular binding was monitored at 436 nm, and the time courses were normalized from the absorbance changes for the fast bimolecular phases for ease of comparison between the mutants. A, time courses for bimolecular O2 binding to mutant α subunits, where E7 refers to position 58; B, time courses for O2 binding to mutant β subunits, where E7 refers to position 63.
FIGURE 3.
FIGURE 3.
Time courses for bimolecular CO binding to wild-type and E7 mutants of isolated human HbA subunits after laser photolysis. A, CO binding to mutant α subunits, and B, CO binding to mutant β subunits, both at [CO] = 1000 μm (1 atm). C, CO binding to isolated αTrp(E7) subunits at four different [CO] labeled beside each time course. The observed bimolecular rates for the fast phases of the reactions were as follows: 16,500 s−1, 50 μm CO; 46,000 s−1, 350 μm CO; 90,000 s−1, 750 μm CO; and 125,000 s−1, 1000 μm CO. The subunit concentration was 50 μm. D, more detailed comparison between the time courses for bimolecular CO binding to monomeric α- and βTrp(E7) mutants on both long and short time scales at [CO] = 1000 μm. Buffer conditions were the same as in Fig. 2. Several crystals of sodium dithionite were added into each cuvette to scavenge any residual O2.
FIGURE 4.
FIGURE 4.
Geminate CO recombination in wild-type and E7 mutants of isolated α and β subunits of recombinant human HbA. In these experiments, ∼50 μm HbCO was photolyzed with a 7-ns Nd:YAG laser excitation pulse (at time 0.0) in 1000 μm CO. Buffer conditions were the same as in Fig. 2. Geminate recombination was monitored at 436 nm, and the absorbance changes were normalized for comparison between the mutants. Time courses were fitted to single exponential expressions; Fgem is calculated as (total ΔA436 − offset)/(total ΔA436); kgem is equal to the observed rate of the first order internal rebinding phase. A, time courses for geminate CO recombination to mutant α subunits, where E7 refers to position 58; B, time courses for geminate CO recombination to mutant β subunits, where E7 refers to position 63.
FIGURE 5.
FIGURE 5.
NO binding to E7 mutants of HbA subunits. A, time courses for NO binding to isolated native α and β chains. HbCO samples (∼25 μm, after mixing) were rapidly mixed with NO (1000 μm in final reaction mixture) and then photolyzed ∼50 ms after flow stopped with a 500-ns dye laser pulse. Bimolecular NO binding was observed at 436 nm, and the time courses were normalized by the absorbance change immediately before and after photolysis. The offset after the reaction is complete represents the difference in absorbance between the final product HbNO and the starting HbCO sample. The open circles and open squares represent native α and β subunits, respectively. The black lines represent fits to single exponential expressions for the isolated α (kobs = 28,000 s−1) and β (kobs = 68,000 s−1) subunits. The inset shows the dependence of the observed pseudo first order rate constants of native α and β subunits and HbA tetramers on [NO]. The observed rates show a straight line dependence with a y-intercept equal to 0 because the NO dissociation rate constant is on the order of 10−4 s−1 (13). The open symbols in the inset correspond to the rates for isolated subunits, and the closed symbols represent the rates for the fast (β) and slow (α) HbA phases. The slopes represent the kNO′ values, which are given in Table 3. B, comparison of calculated rates of CO entry with the bimolecular rate constants measured for NO binding to recombinant Hb. Data were taken from Table 3. The closed and open circles represent isolated α and β subunit rate constants, respectively, and the open and closed triangles represent values for the closed α and slowly reacting βTrp(E7) conformers.
FIGURE 6.
FIGURE 6.
Time courses for O2 replacement by CO in native and E7 mutant α and β subunits. The solutions contained a mixture of 625 μm O2 and 500 μm CO. Buffer conditions were the same as in Fig. 2. Absorbance changes were detected at 425 nm and normalized for comparison between the mutants. In these experiments, HbO2 is transiently formed after photolysis of HbCO with a 0.5-μs dye laser pulse, and then O2 is slowly displaced by CO present in the solution. Only the slow O2 replacement phase of the reaction is shown, and for these time courses, the observed first order rate constant, robs, equals kO2/(1 + kO2′[O2]/kCO′ [CO]). A, O2 dissociation from α subunits, where E7 refers to position 58; B, O2 dissociation from α subunits, where E7 refers to position 63.
FIGURE 7.
FIGURE 7.
FTIR spectra of wild-type and E7 mutants of human HbA. Buffer conditions were the same as in Fig. 2. A, spectra for wild-type HbA (solid black) and mutant hybrid Hb tetramers (solid spectra represent Hb tetramers containing mutant α chains; dashed spectra represent Hb tetramers containing mutant β chains). B, spectra of isolated native and mutant α (solid) and β (dashed) subunits.
FIGURE 8.
FIGURE 8.
Structures of the α and β active sites in HbO2. The figures were constructed from the high resolution structure of human oxyhemoglobin A (2DN1) determined by Park et al. (26). The key residues of the heme pocket are labeled and shown in sticks. The atoms of the key amino acids are colored as following: white, carbon; blue, nitrogen; red, oxygen; yellow, the atoms of other amino acids lining the binding site; red, O atoms of bound dioxygen; and orange, heme iron. The blue dotted lines in the α subunits represent H-bonds between His (CE3) and the carboxylate oxygen atoms of the heme 6-propionate, and Lys (E10) and the carboxylates of the heme 7-propionate.
FIGURE 9.
FIGURE 9.
Effects of E7 mutants on KCO,KO2, and their ratio M. A, correlation between logKCO and logKO2 of wild-type and E7 mutant HbA subunits and tetramers. Closed circles represent data for subunits containing polar His and Gln(E7) side chains; open circles represent data for apolar E7 mutants. There is strong linear correlation between logKCO and logKO2 values for the apolar mutants, whereas the polar E7 variants are clearly outliers and show little correlation as a group. B, effects of mutagenesis on ligand discrimination expressed as log(KCO/KO2) or log(M) and plotted as function of the size of the E7 amino acid. Black bars represent α-E7 mutants, and the gray bars represent β-E7 mutants. The upper dashed line represents the logarithm of the average M value for all the apolar mutants, and the lower dashed line represents the logarithm of the average M for HbA subunits. (M) and (T) in the name of the mutant specifies whether log(KCO/KO2) was calculated for isolated subunit monomers or the mutant subunit in hybrid tetramers, respectively. NatHisE7 and WTHisE7 stand for native HbA (derived from red blood cells) and wild-type recombinant HbA (expressed in E. coli). Data for the diagrams were taken from Tables 1 and 2.
FIGURE 10.
FIGURE 10.
Dependence of rate constant for NO association on E7 mutations in monomeric α subunits, β subunits, and Mb. Native HbA contains His at the E7 position. Only the slow phase values for kNO′ for αTrp(E7) was used because it represents NO binding to the closed, physiologically relevant equilibrium state of the mutant. Data for sperm whale Mb mutants were taken from Ref. , and kNO′ for HbA mutants were taken from Table 3.

Similar articles

Cited by

References

    1. Perutz M. F. (1970) Nature 228, 726–739 - PubMed
    1. Pauling L. (1964) Nature 203, 182–183 - PubMed
    1. Perutz M. F., Mathews F. S. (1966) J. Mol. Biol. 21, 199–202 - PubMed
    1. Jameson G. B., Molinaro F. S., Ibers J. A., Collman J. P., Brauman J. I., Rose E., Suslick K. S. (1980) J. Am. Chem. Soc. 102, 3224–3237
    1. Slebodnick C., Ibers J. A. (1997) J. Biol. Inorg. Chem. 2, 521–525

Publication types