

Detection of infectious adenoviruses in environmental waters by fluorescence-activated cell sorting assay
- PMID: 20080992
- PMCID: PMC2832376
- DOI: 10.1128/AEM.01937-09
Detection of infectious adenoviruses in environmental waters by fluorescence-activated cell sorting assay
Abstract
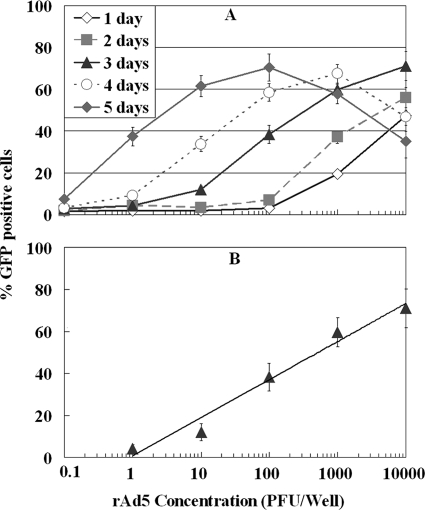
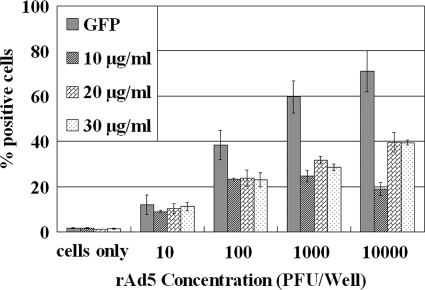
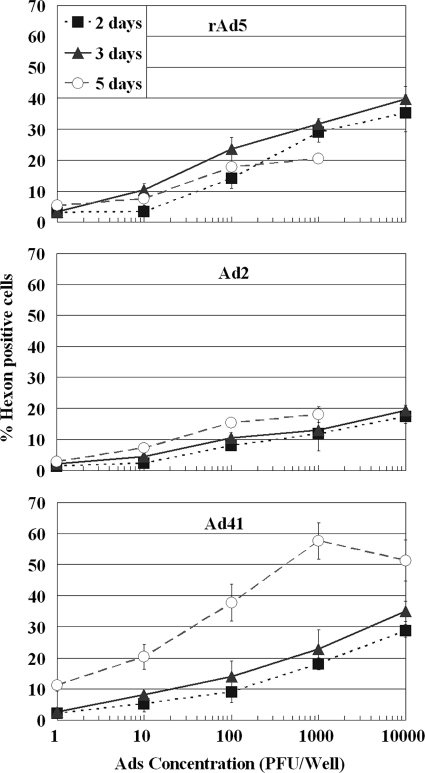
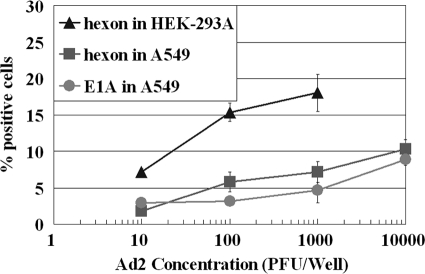
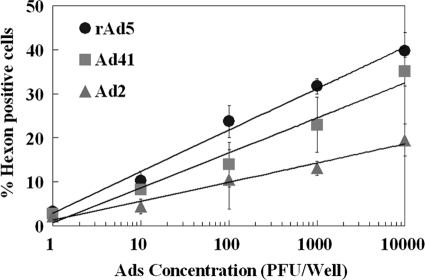
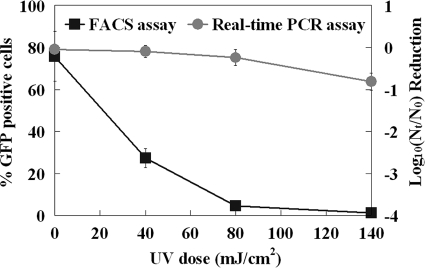
Methods for rapid detection and quantification of infectious viruses in the environment are urgently needed for public health protection. A fluorescence-activated cell-sorting (FACS) assay was developed to detect infectious adenoviruses (Ads) based on the expression of viral protein during replication in cells. The assay was first developed using recombinant Ad serotype 5 (rAd5) with the E1A gene replaced by a green fluorescent protein (GFP) gene. Cells infected with rAd5 express GFP, which is captured and quantified by FACS. The results showed that rAd5 can be detected at concentrations of 1 to 10(4) PFU per assay within 3 days, demonstrating a linear correlation between the viral concentration and the number of GFP-positive cells with an r(2) value of >0.9. Following the same concept, FACS assays using fluorescently labeled antibodies specific to the E1A and hexon proteins, respectively, were developed. Assays targeting hexon showed greater sensitivity than assays targeting E1A. The results demonstrated that as little as 1 PFU Ads was detected by FACS within 3 days based on hexon protein, with an r(2) value greater than 0.9 over a 4-log concentration range. Application of this method to environmental samples indicated positive detection of infectious Ads in 50% of primary sewage samples and 33% of secondary treated sewage samples, but none were found in 12 seawater samples. The infectious Ads ranged in quantity between 10 and 165 PFU/100 ml of sewage samples. The results indicate that the FACS assay is a rapid quantification tool for detecting infectious Ads in environmental samples and also represents a considerable advancement for rapid environmental monitoring of infectious viruses.
Figures
Similar articles
-
An improved infectivity assay combining cell culture with real-time PCR for rapid quantification of human adenoviruses 41 and semi-quantification of human adenovirus in sewage.Water Res. 2013 Jun 1;47(9):3183-91. doi: 10.1016/j.watres.2013.03.022. Epub 2013 Mar 26. Water Res. 2013. PMID: 23579085
-
Detection and quantitation of infectious human adenoviruses and JC polyomaviruses in water by immunofluorescence assay.J Virol Methods. 2011 Jan;171(1):1-7. doi: 10.1016/j.jviromet.2010.09.013. Epub 2010 Sep 21. J Virol Methods. 2011. PMID: 20863853
-
Quantification of enterococci and human adenoviruses in environmental samples by real-time PCR.Appl Environ Microbiol. 2005 May;71(5):2250-5. doi: 10.1128/AEM.71.5.2250-2255.2005. Appl Environ Microbiol. 2005. PMID: 15870308 Free PMC article.
-
A Cell-Based Capture Assay for Rapid Virus Detection.Viruses. 2020 Oct 15;12(10):1165. doi: 10.3390/v12101165. Viruses. 2020. PMID: 33076296 Free PMC article.
-
Ultrahigh-throughput FACS-based screening for directed enzyme evolution.Chembiochem. 2009 Nov 23;10(17):2704-15. doi: 10.1002/cbic.200900384. Chembiochem. 2009. PMID: 19780076 Review.
Cited by
-
An image cytometric technique is a concise method to detect adenoviruses and host cell proteins and to monitor the infection and cellular responses induced.Virol J. 2017 Nov 10;14(1):219. doi: 10.1186/s12985-017-0888-0. Virol J. 2017. PMID: 29126418 Free PMC article.
-
A Two-Dimensional Affinity Capture and Separation Mini-Platform for the Isolation, Enrichment, and Quantification of Biomarkers and Its Potential Use for Liquid Biopsy.Biomedicines. 2020 Jul 30;8(8):255. doi: 10.3390/biomedicines8080255. Biomedicines. 2020. PMID: 32751506 Free PMC article. Review.
-
Infectious Pepper Mild Mottle Virus and Human Adenoviruses as Viral Indices in Sewage and Water Samples.Food Environ Virol. 2022 Sep;14(3):246-257. doi: 10.1007/s12560-022-09525-0. Epub 2022 Jun 17. Food Environ Virol. 2022. PMID: 35713790 Free PMC article.
-
Viruses in wastewater: occurrence, abundance and detection methods.Sci Total Environ. 2020 Nov 25;745:140910. doi: 10.1016/j.scitotenv.2020.140910. Epub 2020 Jul 19. Sci Total Environ. 2020. PMID: 32758747 Free PMC article. Review.
-
Electrochemical disinfection of toilet wastewater using wastewater electrolysis cell.Water Res. 2016 Apr 1;92:164-72. doi: 10.1016/j.watres.2016.01.040. Epub 2016 Jan 21. Water Res. 2016. PMID: 26854604 Free PMC article.
References
-
- Avery, R. M., A. P. Shelton, G. M. Beards, O. O. Omotade, O. C. Oyejide, and D. O. Olaleye. 1992. Viral agents associated with infantile gastroenteritis in Nigeria—relative prevalence of adenovirus serotype-40 and serotype-41, astrovirus, and rotavirus serotype-1 to serotype-4. J. Diarrheal Dis. Res. 10:105-108. - PubMed
-
- Baxter, C. S., R. Hofmann, M. R. Templeton, M. Brown, and R. C. Andrews. 2007. Inactivation of adenovirus types 2, 5, and 41 in drinking water by UV light, free chlorine, and monochloramine. J. Environ. Eng. 133:95-103.
-
- Bottley, G., J. R. Holt, N. J. James, and G. E. Blair. 2007. Flow cytometric detection of adenoviruses and intracellular adenovirus proteins. Methods Mol. Med. 130:205-213. - PubMed
Publication types
MeSH terms
Substances
LinkOut - more resources
Full Text Sources
Other Literature Sources
