

doi: 10.1128/AEM.00824-09.
Epub 2010 Jan 15.
Revisiting with a relative-density calibration approach the determination of growth rates of microorganisms by use of optical density data from liquid cultures
Affiliations
- PMID: 20081003
- PMCID: PMC2832404
- DOI: 10.1128/AEM.00824-09
Item in Clipboard
Revisiting with a relative-density calibration approach the determination of growth rates of microorganisms by use of optical density data from liquid cultures
Appl Environ Microbiol.
2010 Mar.
Abstract
To solve the problems of measuring the growth rates of microorganisms from optical density (OD)-growth time plots, we used relative-density (RD) plots. The relationship of OD and RD was built from the diluted grown cultures. This method was satisfactorily applied to study the growth of Escherichia coli and the cyanobacterium Anabaena spiroides.
Figures
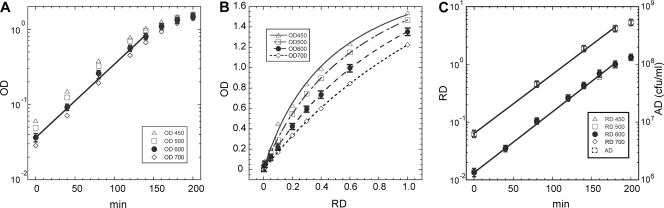
The use of OD readings to determine growth rates of E. coli bacteria. (A) OD-time response of an E. coli culture monitored with light of different wavelengths. The OD of an LB broth-grown E. coli BL21(DE3) culture at 37°C was monitored with light of the indicated wavelengths (e.g., OD600 for measurements with 600-nm light). The doubling times of E. coli cells in the logarithmic growth phase were estimated to be 46 ± 3 min, 43 ± 2 min, 40 ± 2 min, and 38 ± 2 min (mean ± 1 SD) for measurements with 450-nm, 500-nm, 600-nm, and 700-nm light, respectively. The differences among these values are significant (analysis of variance P value, 0.006). (B) RD-OD calibration curves of the bacterial culture whose OD results are shown in panel A. Aliquots of the grown culture were diluted with various amounts of fresh LB broth to prepare reference samples, and their ODs were recorded with light of different wavelengths. (C) RD and AD as a function of growth time of the E. coli culture whose OD results are shown in panel A. The RD data were derived from OD-RD calibration curves and plotted against the growth time. The AD of the cell culture at each indicated time was determined by plating the serially diluted bacterial cultures on LB plates and counting the colonies. An OD of 1.09 at 600 nm corresponds to (3.0 ± 0.5) × 108 CFU/ml. The growth rates are expressed as cell doubling times, which were inferred from the slopes of the regression lines. The error bars represent three standard deviations of the OD600, RD600, and AD measurements (three repeats). For clarity, only the SDs of measurements with 600-nm light are shown. The SDs of measurements with light of other wavelengths were very close to those with the 600-nm light. The reported growth rates are the results of four growth experiments. KaleidaGraph (version 4.0; Synergy Software) was used for curve fitting. Note that in the experiment, we added pregrown cells into prewarmed (37°C) LB medium to avoid the initial slow growth of the cells. The details of E. coli strains and culture conditions are given in the supplemental material.
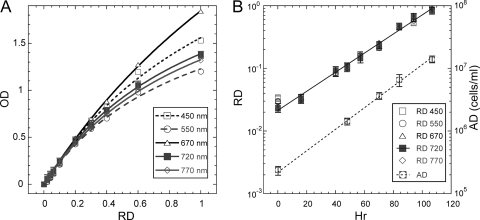
Determination of growth rates of the algal cyanobacterium Anabaena spiroides. (A) OD-RD calibration of an A. spiroides algal culture. The grown algal culture was diluted with fresh medium as described in the text, and light of the indicated wavelengths was used to measure the ODs of the reference samples. (B) RD and AD as functions of growth time of the algal culture shown in panel A. The algal cells were grown in an aerated plain medium for ∼100 h (see the supplemental material for details). The growth of the algal cells was monitored by measuring the OD of the culture with light of the indicated wavelengths. Absolute cell density (cells/ml) was determined by counting the observed cell number under a bright-field microscope. The error bars represent three standard deviations. For clarity, only SDs of measurements (three repeats) with the 720-nm light are shown. The SDs of the measurements with light of other wavelengths were similar to those with the 720-nm light. The growth rates are the results of three growth experiments.
References
-
- Dalgaard, P., and K. Koutsoumanis. 2001. Comparison of maximum specific growth rates and lag times estimated from absorbance and viable count data by different mathematical models. J. Microbiol. Methods 43:183-196. - PubMed
-
- Eisenberg, D., and D. Crothers. 1979. Physical chemistry with applications to the life sciences, p. 516-589. Benjamin Cummings, Menlo Park, CA.
Publication types
MeSH terms
LinkOut - more resources
Full Text Sources
Other Literature Sources
Miscellaneous
