

Comparison of two optical-density-based methods and a plate count method for estimation of growth parameters of Bacillus cereus
- PMID: 20081006
- PMCID: PMC2832364
- DOI: 10.1128/AEM.02336-09
Comparison of two optical-density-based methods and a plate count method for estimation of growth parameters of Bacillus cereus
Abstract
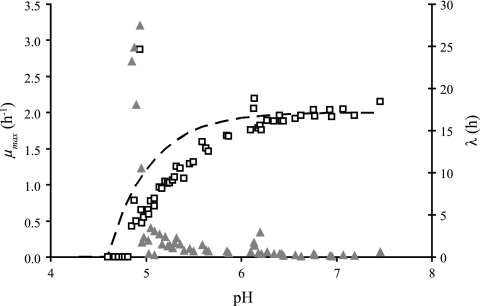
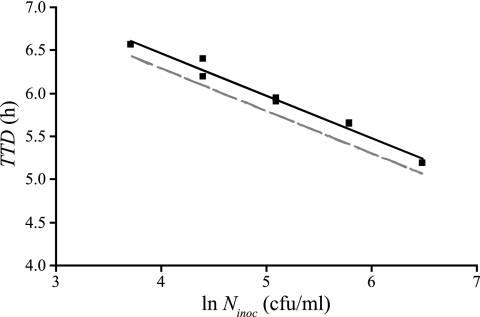
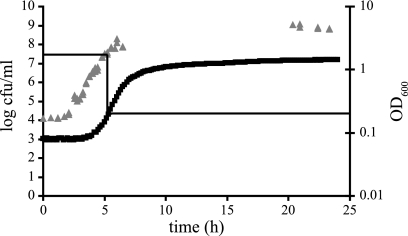
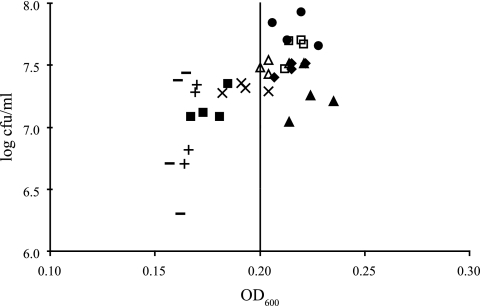
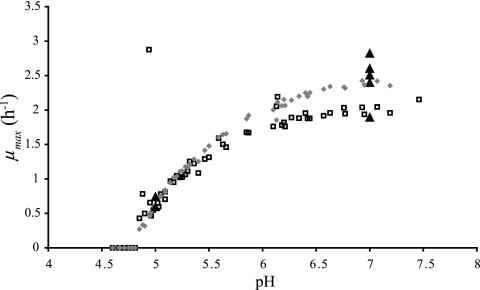
Quantitative microbiological models predicting proliferation of microorganisms relevant for food safety and/or food stability are useful tools to limit the need for generation of biological data through challenge testing and shelf-life testing. The use of these models requires quick and reliable methods for the generation of growth data and estimation of growth parameters. Growth parameter estimation can be achieved using methods based on plate counting and methods based on measuring the optical density. This research compares the plate count method with two optical density methods, namely, the 2-fold dilution (2FD) method and the relative rate to detection (RRD) method. For model organism Bacillus cereus F4810/72, the plate count method and both optical density methods gave comparable estimates for key growth parameters. Values for the maximum specific growth rate (mu(max)) derived by the 2FD method and by the RRD method were of the same order of magnitude, but some marked differences between the two approaches were apparent. Whereas the 2FD method allowed the derivation of values for lag time (lambda) from the data, this was not possible with the RRD method. However, the RRD method gave many more data points per experiment and also gave more data points close to the growth boundary. This research shows that all three proposed methods can be used for parameter estimation but that the choice of method depends on the objectives of the research.
Figures
References
-
- Adams, M. R., and M. O. Moss. 2000. Food microbiology, 2nd ed. The Royal Society of Chemistry, Cambridge, United Kingdom.
-
- Bidlas, E., T. Du, and R. J. W. Lambert. 2008. An explanation for the effect of inoculum size on MIC and the growth/no growth interface. Int. J. Food Microbiol. 126:140-152. - PubMed
-
- Browne, N., and B. C. A. Dowds. 2002. Acid stress in the food pathogen Bacillus cereus. J. Appl. Microbiol. 92:404-414. - PubMed
-
- Cuppers, H. G. A. M., and J. P. P. M. Smelt. 1993. Time to turbidity measurement as a tool for modeling spoilage by Lactobacillus. J. Ind. Microbiol. Biotechnol. 12:168-171.
Publication types
MeSH terms
LinkOut - more resources
Full Text Sources
Other Literature Sources
Molecular Biology Databases
Research Materials
