Characterization of the rice PHO1 gene family reveals a key role for OsPHO1;2 in phosphate homeostasis and the evolution of a distinct clade in dicotyledons
- PMID: 20081045
- PMCID: PMC2832267
- DOI: 10.1104/pp.109.149872
Characterization of the rice PHO1 gene family reveals a key role for OsPHO1;2 in phosphate homeostasis and the evolution of a distinct clade in dicotyledons
Abstract
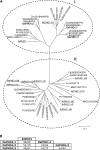
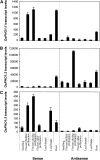
Phosphate homeostasis was studied in a monocotyledonous model plant through the characterization of the PHO1 gene family in rice (Oryza sativa). Bioinformatics and phylogenetic analysis showed that the rice genome has three PHO1 homologs, which cluster with the Arabidopsis (Arabidopsis thaliana) AtPHO1 and AtPHO1;H1, the only two genes known to be involved in root-to-shoot transfer of phosphate. In contrast to the Arabidopsis PHO1 gene family, all three rice PHO1 genes have a cis-natural antisense transcript located at the 5 ' end of the genes. Strand-specific quantitative reverse transcription-PCR analyses revealed distinct patterns of expression for sense and antisense transcripts for all three genes, both at the level of tissue expression and in response to nutrient stress. The most abundantly expressed gene was OsPHO1;2 in the roots, for both sense and antisense transcripts. However, while the OsPHO1;2 sense transcript was relatively stable under various nutrient deficiencies, the antisense transcript was highly induced by inorganic phosphate (Pi) deficiency. Characterization of Ospho1;1 and Ospho1;2 insertion mutants revealed that only Ospho1;2 mutants had defects in Pi homeostasis, namely strong reduction in Pi transfer from root to shoot, which was accompanied by low-shoot and high-root Pi. Our data identify OsPHO1;2 as playing a key role in the transfer of Pi from roots to shoots in rice, and indicate that this gene could be regulated by its cis-natural antisense transcripts. Furthermore, phylogenetic analysis of PHO1 homologs in monocotyledons and dicotyledons revealed the emergence of a distinct clade of PHO1 genes in dicotyledons, which include members having roles other than long-distance Pi transport.
Figures


Similar articles
-
Members of the PHO1 gene family show limited functional redundancy in phosphate transfer to the shoot, and are regulated by phosphate deficiency via distinct pathways.Plant J. 2007 Jun;50(6):982-94. doi: 10.1111/j.1365-313X.2007.03108.x. Epub 2007 Apr 25. Plant J. 2007. PMID: 17461783
-
Transcriptome analysis with different leaf blades identifies the phloem-specific phosphate transporter OsPHO1;3 required for phosphate homeostasis in rice.Plant J. 2024 May;118(3):905-919. doi: 10.1111/tpj.16645. Epub 2024 Jan 22. Plant J. 2024. PMID: 38251949
-
A rice cis-natural antisense RNA acts as a translational enhancer for its cognate mRNA and contributes to phosphate homeostasis and plant fitness.Plant Cell. 2013 Oct;25(10):4166-82. doi: 10.1105/tpc.113.116251. Epub 2013 Oct 4. Plant Cell. 2013. PMID: 24096344 Free PMC article.
-
Editing cis-elements of OsPHO1;2 improved phosphate transport and yield in rice.Plant Biotechnol J. 2025 Sep;23(9):3864-3878. doi: 10.1111/pbi.70165. Epub 2025 Jun 17. Plant Biotechnol J. 2025. PMID: 40525270 Free PMC article.
-
MicroRNA-mediated surveillance of phosphate transporters on the move.Trends Plant Sci. 2014 Oct;19(10):647-55. doi: 10.1016/j.tplants.2014.06.004. Epub 2014 Jul 4. Trends Plant Sci. 2014. PMID: 25001521 Review.
Cited by
-
Genome-wide identification and characterization of SPX-domain-containing protein gene family in Solanum lycopersicum.PeerJ. 2021 Dec 22;9:e12689. doi: 10.7717/peerj.12689. eCollection 2021. PeerJ. 2021. PMID: 35036163 Free PMC article.
-
Individual versus Combinatorial Effects of Silicon, Phosphate, and Iron Deficiency on the Growth of Lowland and Upland Rice Varieties.Int J Mol Sci. 2018 Mar 18;19(3):899. doi: 10.3390/ijms19030899. Int J Mol Sci. 2018. PMID: 29562647 Free PMC article.
-
Are rice (Oryza sativa L.) phosphate transporters regulated similarly by phosphate and arsenate? A comprehensive study.Plant Mol Biol. 2014 Jun;85(3):301-16. doi: 10.1007/s11103-014-0186-9. Epub 2014 Apr 12. Plant Mol Biol. 2014. PMID: 24729002
-
Phosphate Uptake and Allocation - A Closer Look at Arabidopsis thaliana L. and Oryza sativa L.Front Plant Sci. 2016 Aug 15;7:1198. doi: 10.3389/fpls.2016.01198. eCollection 2016. Front Plant Sci. 2016. PMID: 27574525 Free PMC article. Review.
-
Phosphorus deficiency induces sexual reproduction in the dinoflagellate Prorocentrum cordatum.Sci Rep. 2023 Aug 30;13(1):14191. doi: 10.1038/s41598-023-41339-3. Sci Rep. 2023. PMID: 37648777 Free PMC article.
References
-
- Abel S, Ticconi CA, Delatorre CA. (2002) Phosphate sensing in higher plants. Physiol Plant 115: 1–8 - PubMed
-
- Ai P, Sun S, Zhao J, Fan X, Xin W, Guo Q, Yu L, Shen Q, Wu P, Miller AJ, et al. (2009) Two rice phosphate transporters, OsPht1;2 and OsPht1;6, have different functions and kinetic properties in uptake and translocation. Plant J 57: 798–809 - PubMed
-
- Ames BN. (1966) Assay of inorganic phosphate, total phosphate and phosphatases. Methods Enzymol 8: 115–118
-
- Chang C, Hu Y, Sun S, Zhu Y, Ma G, Xu G. (2009) Proton pump OsA8 is linked to phosphorus uptake and translocation in rice. J Exp Bot 60: 557–565 - PubMed
Publication types
MeSH terms
Substances
LinkOut - more resources
Full Text Sources
Other Literature Sources
Molecular Biology Databases
Research Materials
Miscellaneous

