. 2010 Feb;13(2):232-8.
doi: 10.1038/nn.2478. Epub 2010 Jan 17.

Glutamate co-release at GABA/glycinergic synapses is crucial for the refinement of an inhibitory map

Affiliations

Glutamate co-release at GABA/glycinergic synapses is crucial for the refinement of an inhibitory map

Jihyun Noh et al. Nat Neurosci. 2010 Feb.

Abstract

Many nonglutamatergic synaptic terminals in the mammalian brain contain the vesicular glutamate transporter 3 (VGLUT3), indicating that they co-release the excitatory neurotransmitter glutamate. However, the functional role of glutamate co-transmission at these synapses is poorly understood. In the auditory system, VGLUT3 expression and glutamate co-transmission are prominent in a developing GABA/glycinergic sound-localization pathway. We found that mice with a genetic deletion of Vglut3 (also known as Slc17a8) had disrupted glutamate co-transmission and severe impairment in the refinement of this inhibitory pathway. Specifically, loss of glutamate co-transmission disrupted synaptic silencing and the strengthening of GABA/glycinergic connections that normally occur with maturation. Functional mapping studies further revealed that these deficits markedly degraded the precision of tonotopy in this inhibitory auditory pathway. These results indicate that glutamate co-transmission is crucial for the synaptic reorganization and topographic specification of a developing inhibitory circuit.


Figures

Figure 1
Figure 1
VGLUT3 expression is required for glutamate co-transmission at GABA/glycinergic MNTB-LSO synapses. MNTB-elicited synaptic currents recorded from LSO neurons in Mg2+-free solution. (a) In VGLUT3+/+ mice (P4–6), the specific GABAA receptor antagonist SR95531 and the glycine receptors antagonist strychnine (SR+Str, dark grey trace) partially blocked responses. The SR+Str insensitive response was abolished by the addition of the specific NMDA receptor antagonist APV and the AMPA receptor antagonist CNQX (SR+Str+CNQX+APV, light gray trace). Arrowhead; stimulation artifact. (b) In VGLUT3−/− mice, MNTB-elicited responses were almost completely blocked by SR+Str (grey trace; control, 1404 ± 218 pA; SR+Str, 61 ± 17 pA; n=13). Current traces in (a) and (b) are averages of 5–10 consecutive single responses.
Figure 2
Figure 2
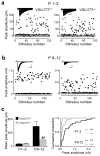
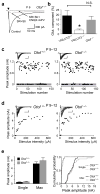
Strengthening of single-fiber MNTB-LSO connections is impaired in VGLUT3−/− mice. (a) Examples of minimal stimulation responses in LSO neurons from VGLUT3+/+ and VGLUT3−/− mice aged P1–2. Gray bar indicates noise level; Insert: Superposition of 120 consecutive current traces. Scale bar 50 pA, 10 ms. (b) Minimal stimulation responses in mice aged P9–12 mice (Left, VGLUT3+/+; Right, VGLUT3−/−). Scale bars 200 pA, 10 ms. (c) Population data. At P1–2, single-fiber responses (mean of averaged response per cells) were not significantly different between VGLUT3+/+ (71 ± 9 pA, n = 12 cells) and VGLUT3−/− mice (83 ± 10 pA, n = 16 cells; P > 0.3, Students’s t-test). At P9–12, responses were significantly larger in VGLUT3+/+ (587 ± 130 pA, n = 21 cells) than in VGLUT3−/− mice (192 ± 38 pA, n = 23 cells; **P<0.005, Left). Right: Cumulative probability histograms for single-fiber responses at P1–2 and P9–12 in VGLUT3+/+ and VGLUT3−/− mice (P1–2, P > 0.2; P9–12, P < 0.005; Kolmogorov-Smirnov test).
Figure 3
Figure 3
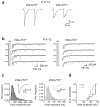
Paired-pulse responses in LSO neurons from VGLUT3+/+ and VGLUT3−/− mice (P9–12). (a) Example traces of MNTB-elicited synaptic currents. (bd) MNTB-evoked miniature postsynaptic currents (mPSCs) in Sr2+. (c) Example traces of evoked mPSCs. sa, stimulus artifacts (truncated). (c) Amplitude histograms of evoked mPSCs with Gaussian fits. Insets show averaged traces of evoked mPSCs. (d) Cumulative plot of amplitudes as determined from Gaussian fits. The amplitudes of mPSCs were about 17% smaller in VGLUT3−/− mice compared to VGLUT3+/+ (VGLUT3+/+: 47.8 ± 3.3 pA, n = 8 cells; VGLUT3−/−: 39.6 ± 2.3, n=12, n = 12 cells; P < 0.05 K-S test).
Figure 4
Figure 4
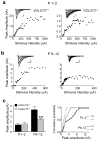
Disruption of glutamate co-transmission impairs the developmental strengthening of all converging MNTB inputs. (a) Examples of stimulus-response relationship in LSO neurons from P1–2 mice. Insets: Superimposed consecutive traces. Scale bars 300 pA, 20 ms. Arrows – stimulation artifact. (b), Same as (a), but for mice aged P9–12. Scale bars 1000 pA, 20 ms (c) Population data. At P1–2, the mean amplitude of maximal responses was not significantly different between VGLUT3+/+ (1.3 ± 0.2 nA, n = 15) and VGLUT3−/− (1.5 ± 0.2 nA, n = 17; P > 0.4). At P9–12, the mean amplitude of maximal responses was significantly larger in VGLUT3+/+ mice (4.3 ± 0.5 nA, n = 36) than in VGLUT3−/− mice (2.4 ± 0.2 nA, n = 44; ***P<0.001, Student’s t-test). Right: Cumulative probability histograms for maximal responses at P1–2 and P9–12 in VGLUT3+/+ and VGLUT3−/− mice (P1–2, P > 0.5; P9–12, P < 0.002; Kolmogorov-Smirnov test).
Figure 5
Figure 5
Topographic sharpening of MNTB-LSO input maps is impaired in VGLUT3−/− mice. (a) Examples of MNTB input maps in VGLUT3+/+ and VGLUT3−/− mice. Scanning grid has been overlaid above a photograph of the MNTB in the slice. Uncaging sites inside the MNTB which elicited a synaptic response in the recorded LSO neuron are filled in red. For each map, example current traces are shown for connected (hatched) and non-connected areas (open). (b) Normalized size of inputs maps at P1–3 and P9–12. At P1–3, input areas were not different between VGLUT3+/+ (30.6 ± 3.3 %, n = 6) and VGLUT3−/− mice (34.6 ± 4.6 %, n = 6; P > 0.5, Student’s t-test). However, at P9–12, input areas were significantly smaller in VGLUT3+/+ mice(15.6 ± 1.5 %, n = 13) than in VGLUT3−/− (29.4 ± 1.6 %, n = 15; ***P < 0.001, Student’s t-test). (c) Normalized input widths along the medio-lateral direction, the tonotopic axis in the MNTB. At P1–3, there was no difference in input width between both groups (VGLUT3+/+, 34.2 ± 3.2 %, n = 6; VGLUT3−/−, 42.0 ± 3.8 %, n = 6; P > 0.1, Student’s t-test). At P9–12, input width of VGLUT3+/+ mice was significantly narrower than in VGLUT3−/− mice (VGLUT3+/+, 23.8 ± 2.1 %, n = 13; VGLUT3−/−,39.3 ± 1.6 %, n = 15; ***P < 0.0001, Student’s t-test).
Figure 6
Figure 6
Membrane properties of MNTB neurons and spatial resolution of glutamate photolysis in the MNTB are not different in VGLUT3+/+ and VGLUT3−/− mice. (a) Membrane voltage responses of MNTB neurons (P9–11) in current clamp in response to injection of current steps. Negative current injections generated a slowly relaxing hyperpolarization ‘sag’. (b) Current-voltage relationships. Inward rectification in response to hyperpolarizing current pulses was present in all neurons (VGLUT3+/+, black, n = 8; VGLUT3−/−, grey, n = 11; close circle - peak; open circle - steady-state, ss). The input resistance was not significantly different between VGLUT3+/+ (88.7 ± 3.1 MΩ, n = 8) and VGLUT3−/− mice (103.7 ± 7.4 MΩ, n = 11; P > 0.1, Student’s t-test). (c) The effective resolution of uncaging (spike eliciting uncaging distance 2) was not different between VGLUT3+/+ and VGLUT3−/− mice. Glutamate uncaging-elicited responses were recorded in MNTB neurons (location marked by X). UV flash durations (100 ms) and caged glutamate concentrations (1 mM) were the same as in the mapping experiments. In both VGLUT3+/+ (n = 8) and VGLUT3−/− mice (n = 11), action potentials occurred only when uncaging occurred in the square above the recorded MNTB neuron (n = 8).
Figure 7
Figure 7
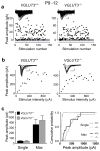
Glutamatergic CN-LSO inputs are normal in VGLUT3−/− mice. (a) Examples of single-fiber CN-LSO responses in P9–12 animals. Gray bar indicates noise level. Insest: Superposition of 130 consecutive current traces. Scale bars 20 pA, 2 ms (b) Examples of maximal responses. Scale bars 100 pA, 5 ms. (c) Single-fiber and maximal responses were not different in VGLUT3+/+ and VGLUT3−/− mice (Single-fiber: VGLUT3+/+, 47 ± 6 pA, n = 7; VGLUT3−/−, 44 ± 6 pA, n = 12; P > 0.7, Student’s t-test; Max. responses: VGLUT3+/+, 362 ± 99 pA, n = 8; VGLUT3−/−, 447 ± 82 pA, n = 15; P > 0.5, Student’s t-test). Right: Cumulative amplitude histogram (Single-fiber, P > 0.7; Max., P > 0.6; Kolmogorov-Smirnov test).
Figure 8
Figure 8
Normal glutamate co-transmission at MNTB-LSO synapses in Otoferlin knockout mice (Otof−/−). (a) Example of MNTB-elicited synaptic responses in an LSO neuron from an Otof−/− mouse (P6). In Mg2+-free solution currents were partially blocked by SR95531 and strychnine (SR+Str, red traces) (Control, 1831 ± 79 pA; SR+Str, 254 ± 82 p A; n = 5). The remaining current was blocked by APV and CNQX (SR+Str+CNQX+APV, gray trace). Arrowhead; stimulation artifact. Traces are averages of 5–10 consecutive responses. (b) In average, 15±4 % of synaptic peak current in Otof −/− mice was mediated by glutamate receptors (n = 5). This value was not significantly different from VGLUT3+/+ mice (VGLUT3+/+:19 %, P > 0.5). Error bars indicate mean±S.E.M. (c–e) Undisturbed refinement of MNTB-LSO connectivity in Otof−/− mice. (c) Examples of single-fiber responses. Insets: Superposition of 150 consecutive traces. Scale bars 400 pA, 10 ms (d) Examples of stimulation-response curves. Scale bars 1000 pA, 20 ms. (e) Comparison of means and cumulative histograms show no difference in single-fiber and maximal response amplitudes in Otof+/− and Otof−/− mice (Means: Single-fiber: Otof+/−, 406 ± 111 pA, n = 14; Otof−/−, 522 ± 124 pA, n = 19; P > 0.5; Student’s t-test. Max.: Otof+/−, 5.2 ± 0.5 nA, n = 18; Otof−/−, 6.0 ± 0.7 nA, n = 26; P > 0.3; Student t-test; Cumulative probability: Single-fiber, P > 0.7; Max., P > 0.9; Kolmogorov-Smirnov test).

Similar articles

Cited by

References

    1. Tollin DJ. The lateral superior olive: a functional role in sound source localization. Neuroscientist. 2003;9:127–143. - PubMed
    1. Kim G, Kandler K. Elimination and strengthening of glycinergic/GABAergic connections during tonotopic map formation. Nat Neurosci. 2003;6:282–290. - PubMed
    1. Kotak VC, Korada S, Schwartz IR, Sanes DH. A developmental shift from GABAergic to glycinergic transmission in the central auditory system. J Neurosci. 1998;18:4646–4655. - PMC - PubMed
    1. Nabekura J, et al. Developmental switch from GABA to glycine release in single central synaptic terminals. Nat Neurosci. 2004;7:17–23. - PubMed
    1. Gillespie DC, Kim G, Kandler K. Inhibitory synapses in the developing auditory system are glutamatergic. Nat Neurosci. 2005;8:332–338. - PubMed

Publication types

MeSH terms