

Meta-analysis of genome-wide association data identifies a risk locus for major mood disorders on 3p21.1
- PMID: 20081856
- PMCID: PMC2854040
- DOI: 10.1038/ng.523
Meta-analysis of genome-wide association data identifies a risk locus for major mood disorders on 3p21.1
Abstract
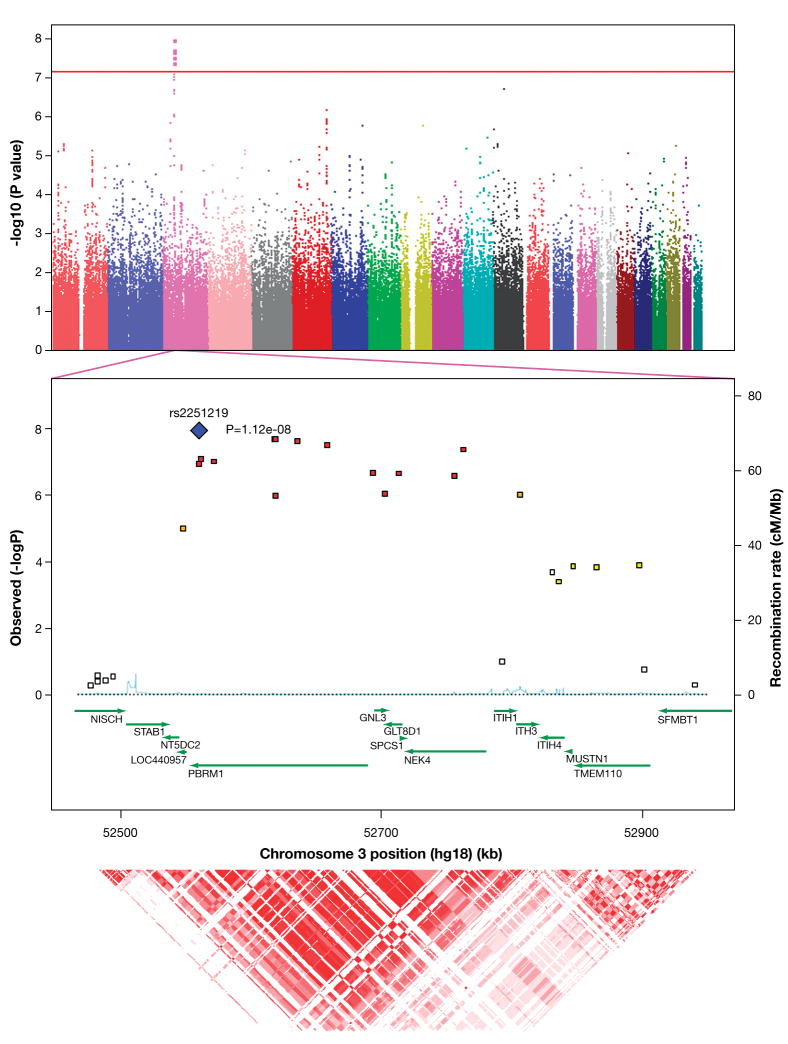
The major mood disorders, which include bipolar disorder and major depressive disorder (MDD), are considered heritable traits, although previous genetic association studies have had limited success in robustly identifying risk loci. We performed a meta-analysis of five case-control cohorts for major mood disorder, including over 13,600 individuals genotyped on high-density SNP arrays. We identified SNPs at 3p21.1 associated with major mood disorders (rs2251219, P = 3.63 x 10(-8); odds ratio = 0.87; 95% confidence interval, 0.83-0.92), with supportive evidence for association observed in two out of three independent replication cohorts. These results provide an example of a shared genetic susceptibility locus for bipolar disorder and MDD.
Figures
Comment in
-
Replication of association of 3p21.1 with susceptibility to bipolar disorder but not major depression.Nat Genet. 2011 Jan;43(1):3-5; author reply 5. doi: 10.1038/ng0111-3. Nat Genet. 2011. PMID: 21217634 No abstract available.
References
-
- Ustun TB, Ayuso-Mateos JL, Chatterji S, Mathers C, Murray CJ. Global burden of depressive disorders in the year 2000. Br J Psychiatry. 2004;184:386–92. - PubMed
-
- Goodwin FK, Jamison K. Manic-Depressive Illness. New York: Oxford Univ Press; pp. 8–26.
-
- Muglia P, et al. Genome-wide association study of recurrent major depressive disorder in two European case-control cohorts. Mol Psychiatry. 2008 Epub ahead of print. - PubMed
Publication types
MeSH terms
Grants and funding
LinkOut - more resources
Full Text Sources
Other Literature Sources
Medical
