. 2010 Mar 31;28(3):564-72.
doi: 10.1002/stem.308.

Stem cell shape regulates a chondrogenic versus myogenic fate through Rac1 and N-cadherin

Affiliations

Stem cell shape regulates a chondrogenic versus myogenic fate through Rac1 and N-cadherin

Lin Gao et al. Stem Cells. .

Abstract

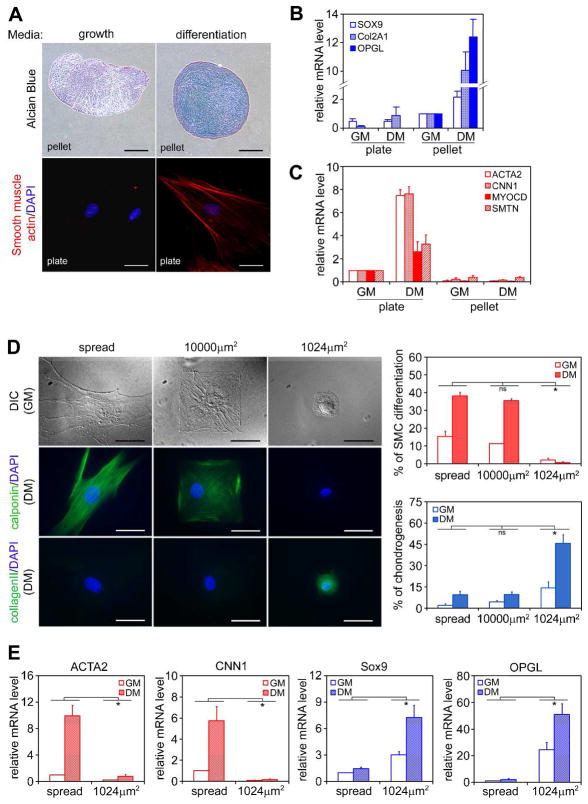
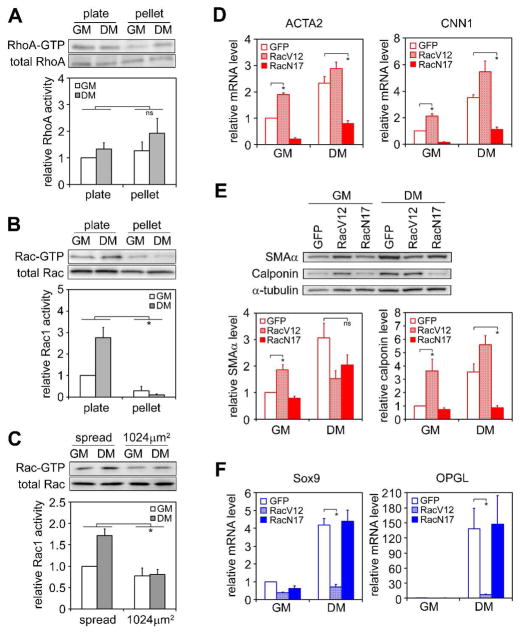
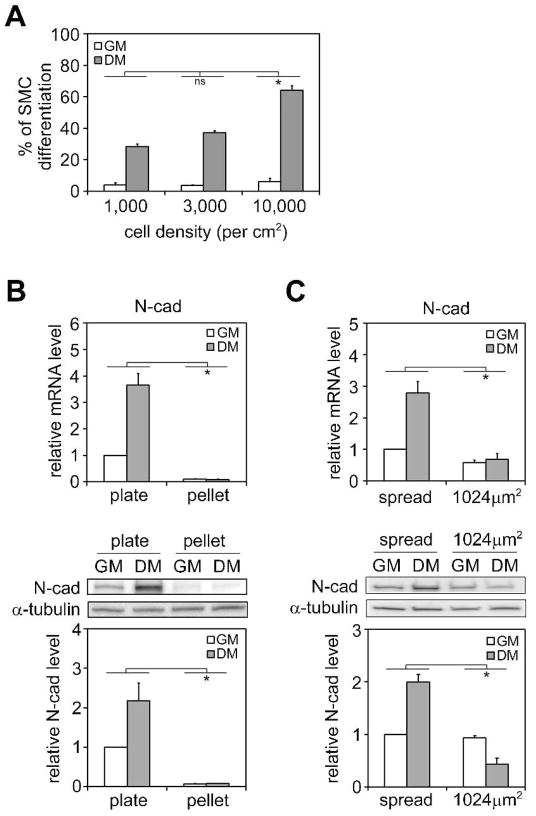
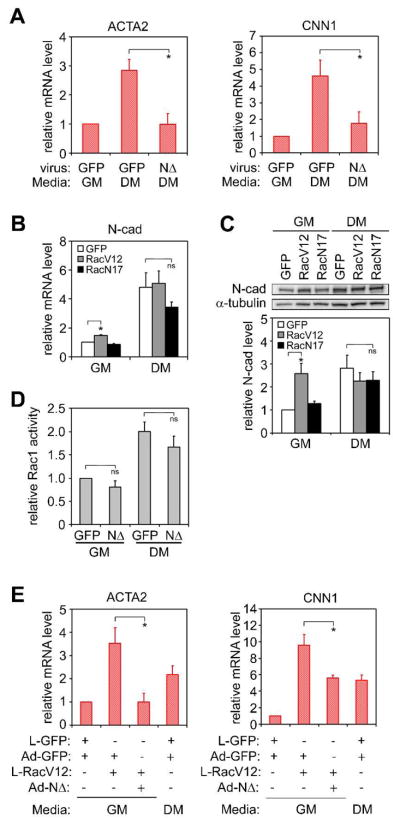
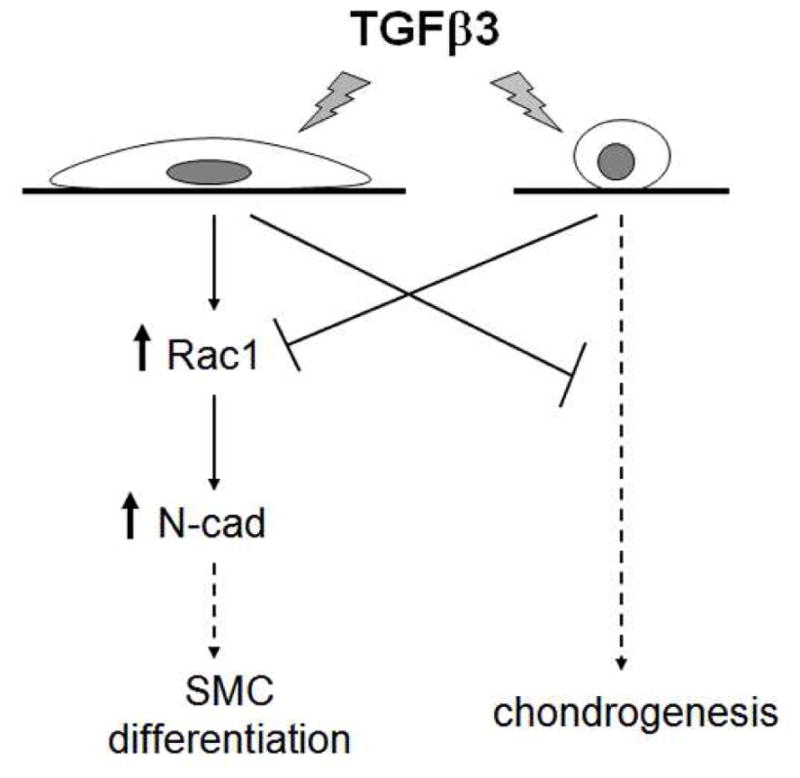
Human mesenchymal stem cells (hMSCs) are multipotent cells that can differentiate into many cell types. Chondrogenesis is induced in hMSCs cultured as a micromass pellet to mimic cellular condensation during cartilage development, and exposed to transforming growth factor beta (TGFbeta). Interestingly, TGFbeta can also induce hMSC differentiation to smooth-muscle-like cell types, but it remains unclear what directs commitment between these two lineages. Our previous work revealed that cell shape regulates hMSC commitment between osteoblasts and adipocytes through RhoA signaling. Here we show that cell shape also confers a switch between chondrogenic and smooth muscle cell (SMC) fates. Adherent and well-spread hMSCs stimulated with TGF beta 3 upregulated SMC genes, whereas cells allowed to attach onto micropatterned substrates, but prevented from spreading and flattening, upregulated chondrogenic genes. Interestingly, cells undergoing SMC differentiation exhibited little change in RhoA, but significantly higher Rac1 activity than chondrogenic cells. Rac1 activation inhibited chondrogenesis and was necessary and sufficient for inducing SMC differentiation. Furthermore, TGF beta 3 and Rac1 signaling upregulated N-cadherin, which was required for SMC differentiation. These results demonstrate a chondrogenic-SMC fate decision mediated by cell shape, Rac1, and N-cadherin, and highlight the tight coupling between lineage commitment and the many changes in cell shape, cell-matrix adhesion, and cell-cell adhesion that occur during morphogenesis.


Figures

Figure 1
Figure 1
Cell shape regulates hMSC differentiation into smooth muscle cells (SMCs) vs. chondrocytes. (A) hMSCs were grown on tissue culture plates (3,000 cells/cm2) or as micromass pellets in growth medium (GM) or differentiation medium (DM) for 7 days. Cells on plates were fixed and stained for α-smooth muscle actin (red) and DAPI (blue). Cell pellets were fixed, embedded in paraffin, sectioned and stained with Alcian Blue. Upper panels: bar =300μm; lower panels: bar =50μm. (B) Real-time PCR analysis of chondrogenic gene expression of hMSCs grown under different culture conditions for 7 days (data are represented as mean±SEM; n=3). SOX9: SRY-box 9; COL2A1: collagen II; OPGL: osteoprotegerin ligand. Although osteoprotegerin ligand (OPGL) is not commonly used as a chondrogenic marker, we found this gene was specifically and robustly upregulated only during hMSC chondrogenesis (Figure S1). (C) Real-time PCR analysis of SMC gene expression of hMSCs grown under different culture conditions for 1 day (data are represented as mean±SEM; n=3). ACTA2: α-smooth muscle actin; CNN1: calponin 1; MYOCD: myocardin; SMTN: smoothelin. (D) hMSCs were grown on either unpatterned fibronectin-coated PDMS substrate, or PDMS substrates patterned with large (10,000μm2) or small (1024μm2) fibronectin islands in GM or DM for 7 days. Cells were fixed, stained for calponin or collagen II (green) and DAPI (blue), and counted (data are represented as mean±SEM; n=3). Bar=50μm. (E) Real-time PCR analysis of SMC and chondrogenic gene expression of hMSCs grown on either flat substrate or 1024μm2 islands after 1 day (data are represented as mean±SEM; n=6). * (P<0.05) and ns (not significant), as calculated by 2-way ANOVA and Tukey’s HSD test.
Figure 2
Figure 2
Rac1 activation is necessary and sufficient for inducing SMC differentiation. (A) Western blot and quantification of total and active RhoA in hMSCs under different culture conditions for 2 days. (B) Western blot and quantification of total and active Rac1 in hMSCs under different culture conditions for 2 days. (C) Western blot and quantification of total and active Rac1 in hMSCs grown on patterned substrates in growth or differentiation medium for 8 hours. (D) Real-time PCR analysis of SMC gene expression in hMSCs transduced with GFP, RacV12, or RacN17 after 1 day in growth or differentiation medium on plate. (E) Western blot and quantification of SMAα and calponin expression in hMSCs transduced with GFP, RacV12, or RacN17 after 7 days in growth or differentiation medium on plate. (F) Real-time PCR analysis of chondrogenic gene expression in hMSCs transduced with GFP, RacV12, or RacN17 and grown as pellets for 14 days in growth or differentiation medium. All data are represented as mean±SEM; n≥3. * (P<0.05) and ns (not significant), as calculated by 2-way ANOVA and Tukey’s HSD test (A, B and C) or student t test (D, E and F).
Figure 3
Figure 3
N-cadherin expression is upregulated during SMC differentiation. (A) hMSCs were plated at different densities and cultured in growth or differentiation medium on plate for 7 days. Cells were fixed, stained for calponin, and counted. (B) Real-time PCR and western blot analysis of N-cadherin mRNA (1 day) and protein expression (7 days) in hMSCs under different culture conditions. (C) Real-time PCR and western blot analysis of N-cadherin mRNA (1 day) and protein expression (7 days) in hMSCs grown on either flat substrate or 1024μm2 islands. All data are represented as mean±SEM; n≥3. * (P<0.05) and ns (not significant), as calculated by 2-way ANOVA and Tukey’s HSD test.
Figure 4
Figure 4
Dominant negative N-Cadherin mutant (NΔ) blocks TGFβ3 and Rac1-induced SMC differentiation. hMSCs were cultured on plates at 3,000 cells/cm2 in growth or differentiation medium. (A) Real-time PCR analysis of SMC gene expression in hMSCs transduced with GFP or NΔ after 1 day. (B) Real-time PCR analysis of N-cadherin mRNA level in hMSCs transduced with GFP, RacV12, or RacN17 after 1 day. (C) Western blot and quantification of N-cadherin protein level in hMSCs transduced with GFP, RacV12, or RacN17 after 7 days. (D) MSCs were transduced with GFP or NΔ and cultured in growth or differentiation media for 2 days. Rac1 activity was examined by G-LISA Rac Activation Assay. (E) Real-time PCR analysis of SMC gene expression in hMSCs co-transduced with different viruses as indicated after 1 day. All data are represented as mean±SEM; n≥3. * (P<0.05) and ns (not significant), as calculated by student t test.
Figure 5
Figure 5
Model of cell shape-regulated hMSC differentiation to SMC or chondrogenic lineage. When cells are well-spread, TGFβ3 activates Rac1 and increases N-cadherin expression, which leads to the upregulation of SMC genes. When cells are in round shape, TGFβ3 fails to activate Rac1 signaling and instead upregulates chondrogenic genes.

References

    1. Pittenger MF, Mackay AM, Beck SC, et al. Multilineage Potential of Adult Human Mesenchymal Stem Cells. Science. 1999;284(5411):143–147. - PubMed
    1. Engler AJ, Sen S, Sweeney HL, et al. Matrix Elasticity Directs Stem Cell Lineage Specification. Cell. 2006;126(4):677–689. - PubMed
    1. McBeath R, Pirone DM, Nelson CM, et al. Cell Shape, Cytoskeletal Tension, and RhoA Regulate Stem Cell Lineage Commitment. Developmental Cell. 2004;6(4):483–495. - PubMed
    1. Ruiz SA, Chen CS. Emergence of Patterned Stem Cell Differentiation Within Multicellular Structures. Stem Cells. 2008;26(11):2921–2927. - PMC - PubMed
    1. Spiegelman BM, Ginty CA. Fibronectin modulation of cell shape and lipogenic gene expression in 3t3-adipocytes. Cell. 1983;35(3 Part 2):657–666. - PubMed

Publication types

MeSH terms