. 2010 Sep;31(9):1359-79.
doi: 10.1002/hbm.20940.

Borders, extent, and topography of human perirhinal cortex as revealed using multiple modern neuroanatomical and pathological markers

Affiliations

Borders, extent, and topography of human perirhinal cortex as revealed using multiple modern neuroanatomical and pathological markers

Song-Lin Ding et al. Hum Brain Mapp. 2010 Sep.

Abstract

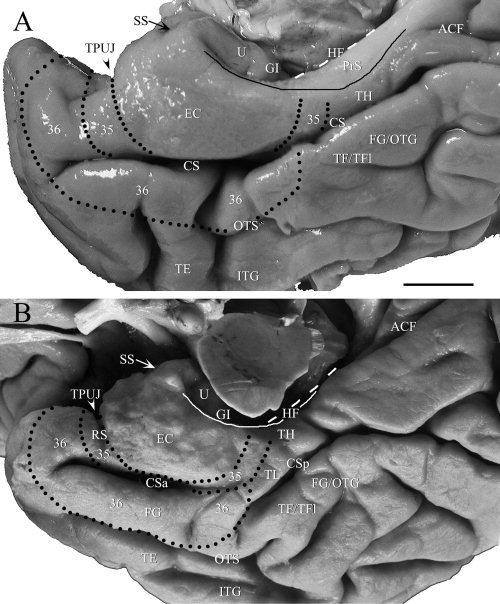
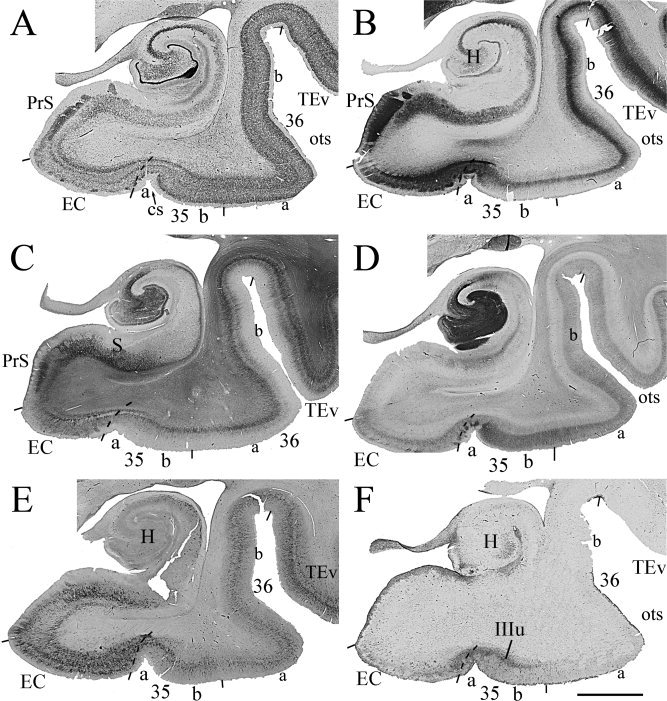
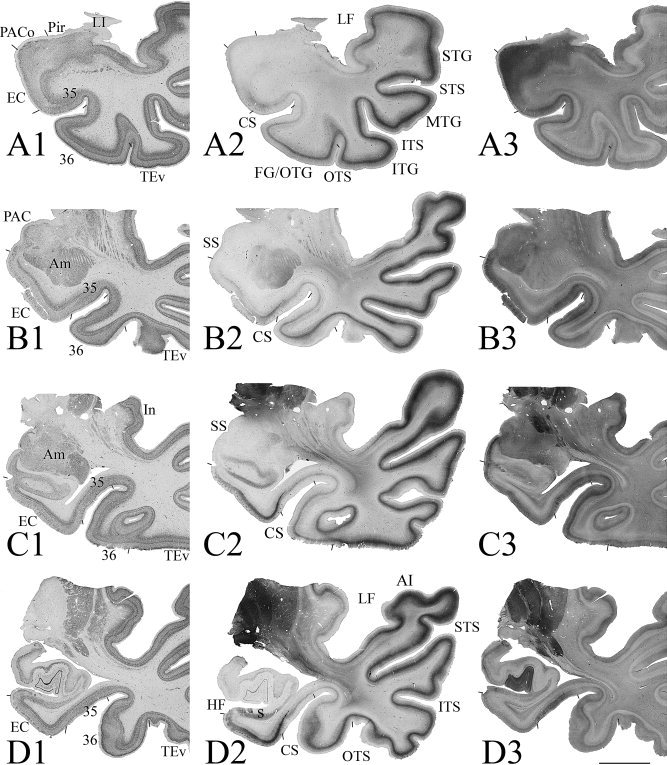
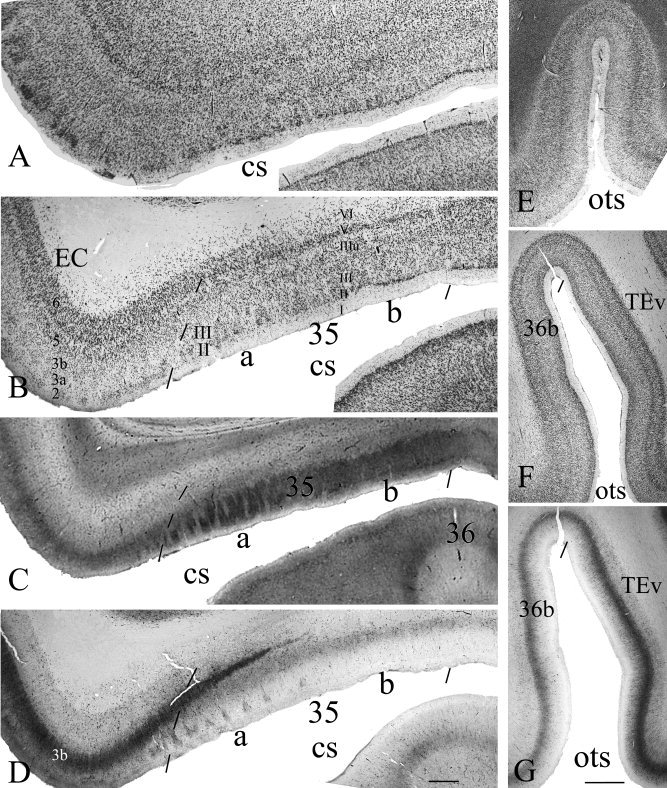
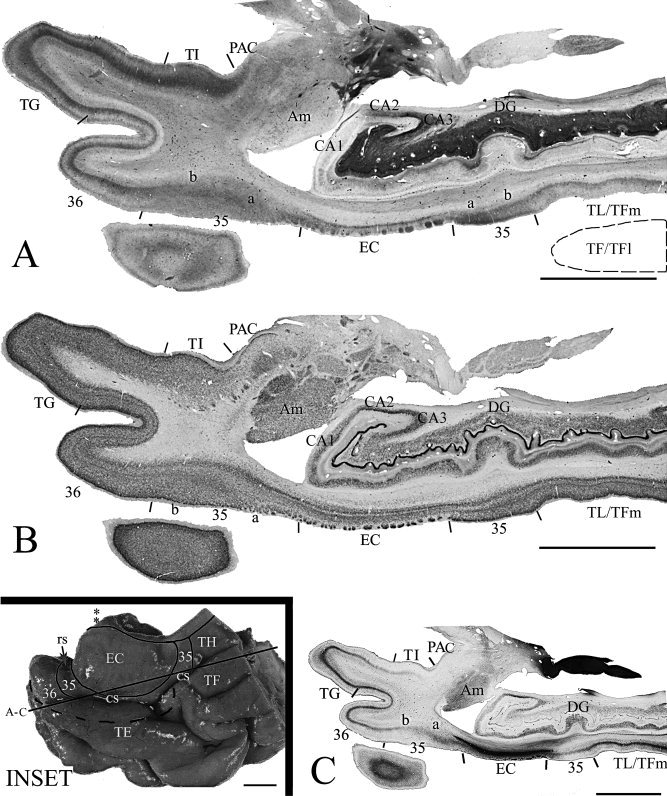
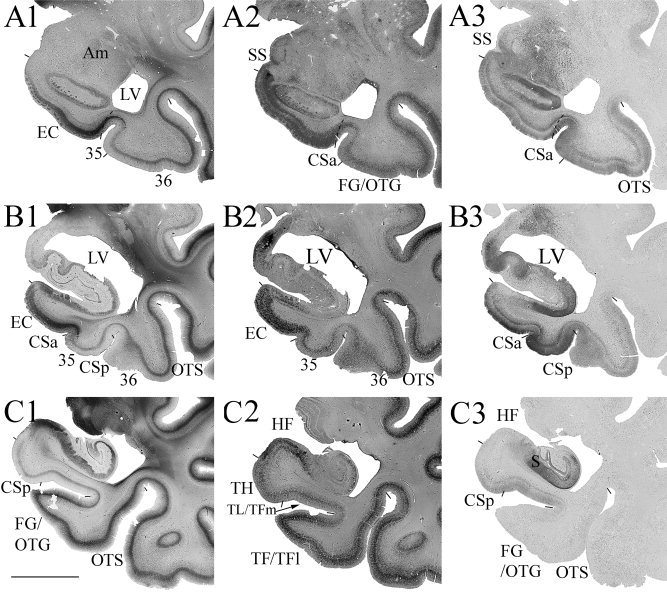
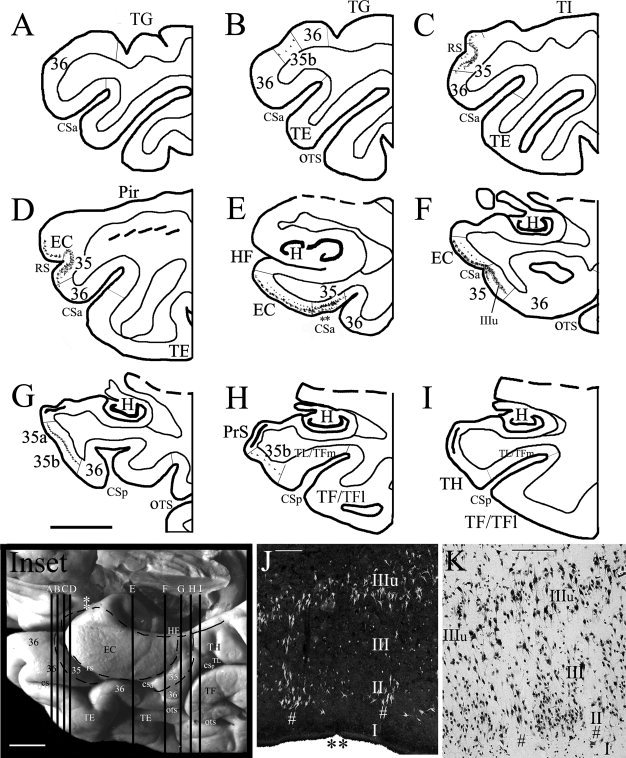
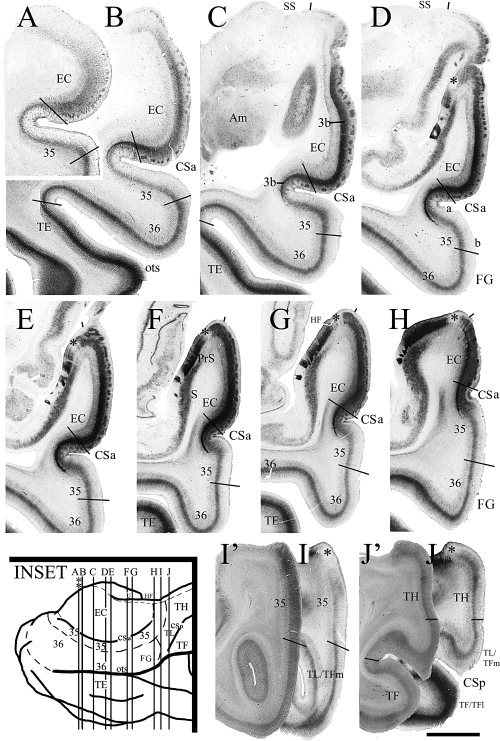
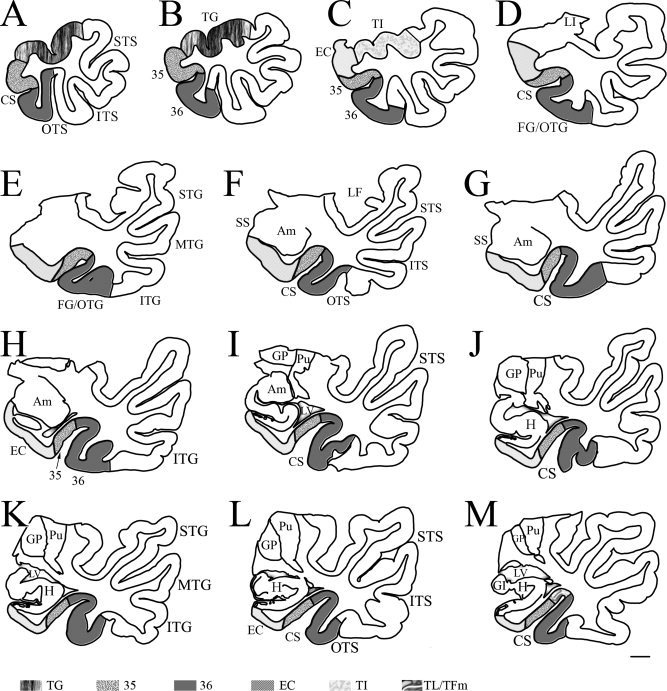
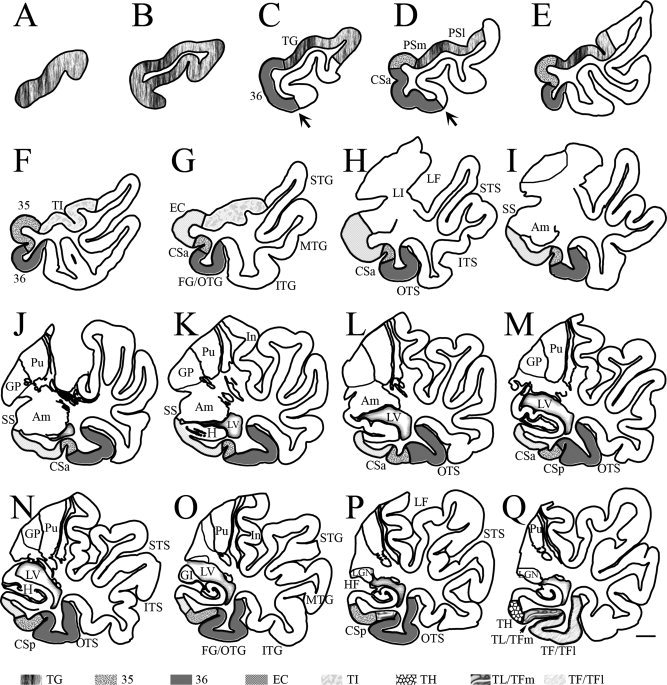
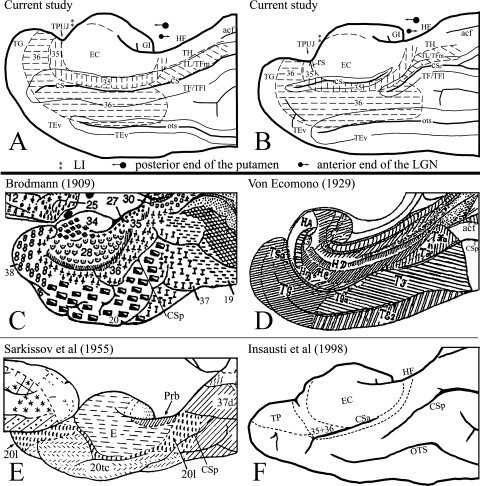
Despite rapidly increasing interests in specific contributions of different components of human medial temporal lobe (MTL) to memory and memory impairments in normal aging and in many abnormal conditions such as Alzheimer's disease and Pick's disease, few modern neuroanatomical studies are available about the borders, extent, and topography of human perirhinal areas 35 and 36, which are important components of the MTL memory system. By a combined use of several cellular, neurochemical, and pathological markers, which mainly include neuronal nuclear antigen, calcium-binding proteins (parvalbumin and calbindin-D28k), nonphosphorylated neurofilament protein (SMI-32), Wisteria floribunda agglutinin, and abnormally phosphorylated tau (AT8), this study has revealed that the borders of human perirhinal areas 35 and 36 are significantly different from those defined with conventional Nissl staining. In general, areas 35 and 36 occupy the ventromedial temporopolar and rhinal sulcal regions, the collateral sulcal region, and the anterior two-thirds of fusiform gyrus or occipitotemporal gyrus. Furthermore, the precise borders, extent, and topography of human areas 35 and 36 and adjoining entorhinal cortex were marked at different anteroposterior levels of the MTL with reference to variations of rhinal and collateral sulci and other useful landmarks. These findings would provide reliable neuroanatomical base for the great and yet rapidly increasing number of neuroimaging studies of the human MTL structures in healthy and many abnormal conditions.


Figures

Figure 1
Figure 1
Photographs of the MTL from two brains show some landmarks and the two basic sulcal patterns of the CS, which is the medial border of the FG/OTG. Dotted lines outline the locations and extent of areas 35 and 36 on the cortical surface. The dashed line shows the long axis of the HF, which can be used with the TPUJ to define the border between the anterior portion of the EC and area 35 when RS does not exist (see text for detail). The solid line marks the proximate border of the PrS with PaS (note the variation of location of the PrS in A and B). (A) One MTL with no RS and a long CS (Type I CS). The shiny and white appearance (due to thick myelinated axons in layer I) on the medial surface of the PPHG indicates the approximate location of the PrS. Area TL/TFm is not seen on the surface of the PPHG because it is hidden in the medial bank of the posterior CS. (B) Another MTL with a deep RS and an interrupted CS (Type II CS). In this case, an anterior (CSa) and a posterior (CSp) segment of the CS were separated by a small cortical bulge. Part of area TL/TFm (TL) is seen on the surface of the PPHG in this case. For abbreviations, see list. Scale bar: 1 cm.
Figure 2
Figure 2
Photomicrographs of six adjacent coronal sections through the GI from a normal case and stained for NeuN (A), PV (B), SMI‐32 (C), CB (D), WFA (E), and AT8 (F) show general features of areas 35 and 36 as well as adjoining regions as seen in sections stained with these markers. It is much easier to define the borders using a combination of different markers. Area 35 can be subdivided into 35a (a) which merges with the EC, and 35b (b) which merges with area 36. Note that some changes in staining intensity and density exist mediolaterally within area 36 (36a vs. 36b), but the borders of area 36 can be confidently placed on the base of multiple stainings. Note also some tau lesion labeled with AT8 was mainly found in layer IIIu (IIIu) of area 35 and less in the EC (F) in this normal case. For abbreviations, see list. Scale bar: 0.5 cm.
Figure 3
Figure 3
Photomicrographs of sequential coronal sections through four different anterior–posterior (AP) levels (A–D) of the MTL from a normal case show the main features of areas 35 and 36 in comparison with adjoining areas. This case has a Type I CS (deep CS) and no RS. At each AP level three adjacent sections were shown and they were stained for NeuN (A1‐D1), PV (A2‐D2), and CB (A3‐D3), respectively. Borders of areas 35 and 36 were defined by a combined analysis of the different markers. Examples of areas 35 and 36 at higher magnifications from this case were shown in Figure 4. For abbreviations, see list. Bar: 1 cm.
Figure 4
Figure 4
Comparison of conventional Nissl stains with a combined use of multiple stains for border definition of human areas 35 and 36. The borders of area 35 with EC and area 36 are less easily appreciated in Nissl preparation (A) than in NeuN stain (B). In contrast, the borders of area 35 can be confidently placed using adjacent sections stained for NeuN (B), CB (C), and PV (D), respectively. Note the distinct CB+ columns in area 35a (C) and the extension of dense PV+ layer 3b of the EC into area 35a (D). Similarly, the border between areas 36 (36b) and TE (TEv) is less easily identified in Nissl preparation (E) than in NeuN (F) and PV (G) stains. Note in (G) the PV staining intensity and density in area TE is much greater than in area 36. For abbreviations, see list. Scale bars: 1 mm in D (A–D); 2 mm in G (E–G).
Figure 5
Figure 5
Localization and topography of areas 35 and 36 in a normal aging case with deep CS and shallow RS, as revealed by adjacent horizontal sections of the temporal lobe stained for CB (A), NeuN (B), and PV (C). Area 35 and its adjoining areas were outlined in the inset, where the location of the LI (indicated by two asterisks) and sections (A)–(C) were also marked. Note that the most anterior and most posterior area 35 can be easily distinguished from the anterior area 36 and the posteriorly located area TL/Tm, respectively, by a combined analysis of different markers. The dashed outline in (A) indicates the location of a missing piece of the lateral bank of the posterior CS, which is occupied by area TF/TFl. For abbreviations, see list. Scale bars: 1 cm.
Figure 6
Figure 6
Photomicrographs of representative coronal sections through three different AP levels (AC) of the MTL from a normal aging case with a Type II CS (shallow) and no RS show the main features of areas 35 and 36 in comparison with adjoining EC and areas TEv, TH, TL/TFm, and TF/TFl. At each AP level, three adjacent sections were shown and they were stained for PV (A1C1), WFA (A2–C2), and AT8 (A3–C3), respectively. Borders of areas 35 and 36 and adjoining areas were defined by a combined analysis of different markers. Clear differences between the anterior FG/OTG (area 36 in A1A3, B1B3) and posterior FG/OTG (area TF/TFl in C1C3) is appreciated in PV (B1, C1), WFA (B2, C2) and AT8 (B3, C3) stained sections. Note the distinct staining intensity in areas 35, 36 and TEv in AT8‐stained sections (A3–C3). Difference in staining intensity of areas 36 and TL/TFm is also seen in PV (B1, C1) and WFA (B2, C2) stained sections. For abbreviations, see list. Scale bar: 1 cm.
Figure 7
Figure 7
Localization and topography of human area 35 in a normal aging case with a Type II CS (deeper CS) and a deeper RS, as determined with Thioflavin‐S and Nissl stains in sequential coronal sections. Area 35 and its adjoining areas were outlined in the inset, where the location of the LI (indicated by two white asterisks) and sections (A)–(I) were marked. (A–I) The location of large NFT+ cells at different AP levels in areas 35 and the EC. The microphotograph of the area 35 in (E) was shown in (J) (the double black asterisks in E and J mark corresponding region). Note that in the most anterior and posterior coronal sections (B, H), large NFT+ pyramidal cells can be observed only in the unique layer IIIu of area 35b but not in the adjoining areas 36, TH, and TL/TFm. (J, K) Microphotographs of the sections from area 35 stained with Thioflavin‐S (J) and NeuN (K) show tau pathology (J) and normal cytology (K) of area 35. Note the early tau lesion in the large pyramidal neurons in layer IIIu and in large‐celled vertical columns (indicated by #) of the superficial layers. For abbreviations, see list. Scale bars: 1 cm in (A)–(I) and inset; 300 μm in J; 200 μm in K.
Figure 8
Figure 8
Localization and topography of human areas 35 and 36 in a normal case with a Type II CS (very shallow CSa) and no RS. In this case, area 35 is mainly located in the fundus, lateral bank of the CSa and the medial half of the crown of the FG/OTG (FG), whereas area 36 occupies the remaining portion of the FG/OTG, including the lateral crown of the FG/OTG and the medial bank of OTS, as determined by adjacent coronal sections stained for different markers (see example in Fig. 2). The topography of areas 35 and 36 and adjoining areas was shown in the inset, where the location of the LI (indicated by two asterisks) and sections (A)–(J) were also marked. (A–J) PV stained sections from different AP levels illustrate the PV staining patterns of areas 35 and 36 and adjoining areas TE, TL/TFm, TH, as well as the EC and PaS. Note in (B) and (C) area 36 can be easily distinguished from adjoining area TE on the base of the staining intensity and density. (I′, J′) CB‐stained sections illustrate the difference between the most posterior area 35 (I′) and the anterior portion of areas TL/TFm and TH (I′, J′). (I′) and (I), (J′) and (J) are adjacent sections. Note the dark CB labeling (I′) and light PV staining (I) in the PaS (indicated by * in D–J). For abbreviations, see list. Scale bar: 500 μm.
Figure 9
Figure 9
Neurolucida drawing of sequential sections (AM) from a temporal lobe (same case as in Fig. 3) with Type I CS (deep) shows the borders, extent, and topography of areas 35 and 36 and adjoining areas as determined with a combined analysis of different markers. The interval between each section is about 2.5 mm. The anterior portion of the FG/OTG (A–M) and the ventromedial portion of the posterior TPC (not shown) is occupied mostly by area 36, whereas the majority of area 35 was located in the medial bank of the CS with the most anterior and posterior area 35 exposed on the medial cortical surface. The microphotographs of the adjacent sections at levels (D), (F), (H), and (K) were shown in Figure 3A1–3,B1–3,C1–3,D1–3, respectively. For abbreviations, see list. Scale bar: 5 mm.
Figure 10
Figure 10
Neurolucida drawing of sequential sections (AQ) from a temporal lobe (same case as in Fig. 6) with Type II (shallow) CS shows the borders, extent, and topography of areas 35 and 36 and adjoining areas as determined with a combined analysis of different markers. The interval between each section is about 2.5 mm. The arrows in (C) and (D) point to the junction of lateral and ventral aspects of the TPC. Note that area 36 occupies most of the ventromedial portion of the posterior TPC (C, D) and the anterior portion of the FG/OTG (E–P). In this case, the majority of area 35 was located in the fundus and lateral bank of the shallow CSa with the most anterior and posterior area 35 exposed on the medial cortical surface. The microphotographs of the adjacent sections at levels (K), (M), and (Q) were shown in Figure 6A1–3,B1–3,C1–3, respectively. For abbreviations, see list. Scale bar: 5 mm.
Figure 11
Figure 11
Summary of the present mapping of human areas 35 and 36 (A, B) and comparison with previous mappings (C–F). (A, B) Medial aspect views of human MTL show the locations and topography of areas 35 and 36 and adjoining regions (outlined by dashed lines) in the brains with type‐I CS (deep CS, A) and type‐II CS (shallow CS, B). The CS and OTS were opened up (outlined by fine continuous lines) for easy viewing of the areas in the sulci. The locations of some critical landmarks for border definition were also labeled. For detailed explanation, see text. (C–F) Medial aspect views of human MTL from previous maps were shown for comparison with the current maps. (C) Map of Brodmann [1909]; (D) map of von Economo [1929]; (E) map of Sarkissov et al. [1955]; (F) map of Insausti et al. [1998b]. Note the CSp is indicated in each map for reference and comparison.

References

    1. Arnold SE ( 2000): Cellular and molecular neuropathology of the parahippocampal region in schizophrenia. Ann NY Acad Sci 911: 275–292. - PubMed
    1. Arnold SE,Hyman BT,Flory J,Damasio AR,Van Hoesen GW ( 1991): The topographical and neuroanatomical distribution of neurofibrillary tangles and neuritic plaques in the cerebral cortex of patients with Alzheimer's disease. Cereb Cortex 1: 103–116. - PubMed
    1. Bernasconi N,Bernasconi A,Caramanos Z,Andermann F,Dubeau F,Arnold DL ( 2000): Morphometric MRI analysis of the parahippocampal region in temporal lobe epilepsy. Ann NY Acad Sci 911: 495–500. - PubMed
    1. Blatt GJ,Rosene DL ( 1998): Organization of direct hippocampal efferent projections to the cerebral cortex of the rhesus monkey: Projections from CA1, prosubiculum, and subiculum to the temporal lobe. J Comp Neurol 392: 92–114. - PubMed
    1. Blatt GJ,Pandya DN,Rosene DL ( 2003): Parcellation of cortical afferents to three distinct sectors in the parahippocampal gyrus of the rhesus monkey: An anatomical and neurophysiological study. J Comp Neurol 466: 161–179. - PubMed

Publication types

MeSH terms