

Discrepancies between metabolic activity and DNA content as tool to assess cell proliferation in cancer research
- PMID: 20082656
- PMCID: PMC3823131
- DOI: 10.1111/j.1582-4934.2010.01013.x
Discrepancies between metabolic activity and DNA content as tool to assess cell proliferation in cancer research
Abstract
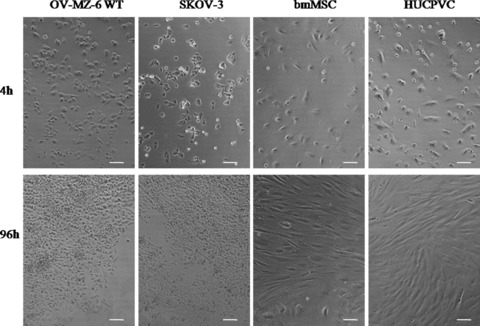
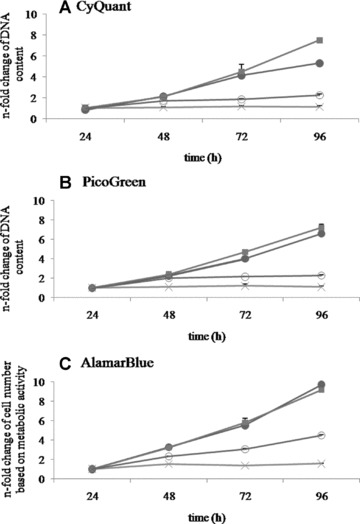
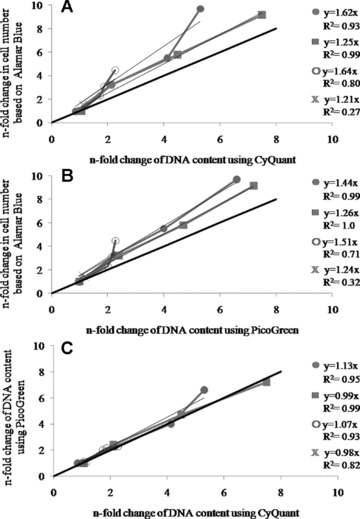
Cell proliferation is a critical and frequently studied feature of molecular biology in cancer research. Therefore, various assays are available using different strategies to measure cell proliferation. Metabolic assays such as AlamarBlue, water-soluble tetrazolium salt and 3-(4,5-dimethylthiazol-2-yl)-2,5-diphenyl tetrazolium bromide, which were originally developed to determine cell toxicity, are used to assess cell numbers. Additionally, proliferative activity can be determined by quantification of DNA content using fluorophores such as CyQuant and PicoGreen. Referring to data published in high ranking cancer journals, these assays were applied in 945 publications over the past 14 years to examine the proliferative behaviour of diverse cell types. In these studies, however, mainly metabolic assays were used to quantify changes in cell growth yet these assays may not accurately reflect cellular proliferation rates due to a miscorrelation of metabolic activity and cell number. Testing this hypothesis, we compared the metabolic activity of different cell types, human cancer cells and primary cells, over a time period of 4 days using AlamarBlue and the fluorometric assays CyQuant and PicoGreen to determine their DNA content. Our results show certain discrepancies in terms of over-estimation of cell proliferation with respect to the metabolic assay in comparison to DNA binding fluorophores.
Figures

References
-
- Jones LJ, Gray M, Yue ST, et al. Sensitive determination of cell number using the CyQUANT cell proliferation assay. J Immunol Methods. 2001;254:85–98. - PubMed
-
- Pierre RV. Peripheral blood film review. The demise of the eyecount leukocyte differential. Clin Lab Med. 2002;22:279–97. - PubMed
-
- Mosmann T. Rapid colorimetric assay for cellular growth and survival: application to proliferation and cytotoxicity assays. J Immunol Methods. 1983;65:55–63. - PubMed
-
- Berridge MV, Herst PM, Tan AS, et al. Biotechnology Annual Review. Elsevier: 2005. Tetrazolium dyes as tools in cell biology: new insights into their cellular reduction; pp. 127–52. - PubMed
-
- O’Brien J, Wilson I, Orton T, et al. Investigation of the Alamar Blue (resazurin) fluorescent dye for the assessment of mammalian cell cytotoxicity. Eur J Biochem. 2000;267:5421–6. - PubMed
Publication types
MeSH terms
Substances
LinkOut - more resources
Full Text Sources
Other Literature Sources
Miscellaneous
