. 2011 Mar;15(3):555-71.
doi: 10.1111/j.1582-4934.2010.01011.x.

Early defect of transforming growth factor β1 formation in Huntington's disease

Affiliations

Early defect of transforming growth factor β1 formation in Huntington's disease

Giuseppe Battaglia et al. J Cell Mol Med. 2011 Mar.

Abstract

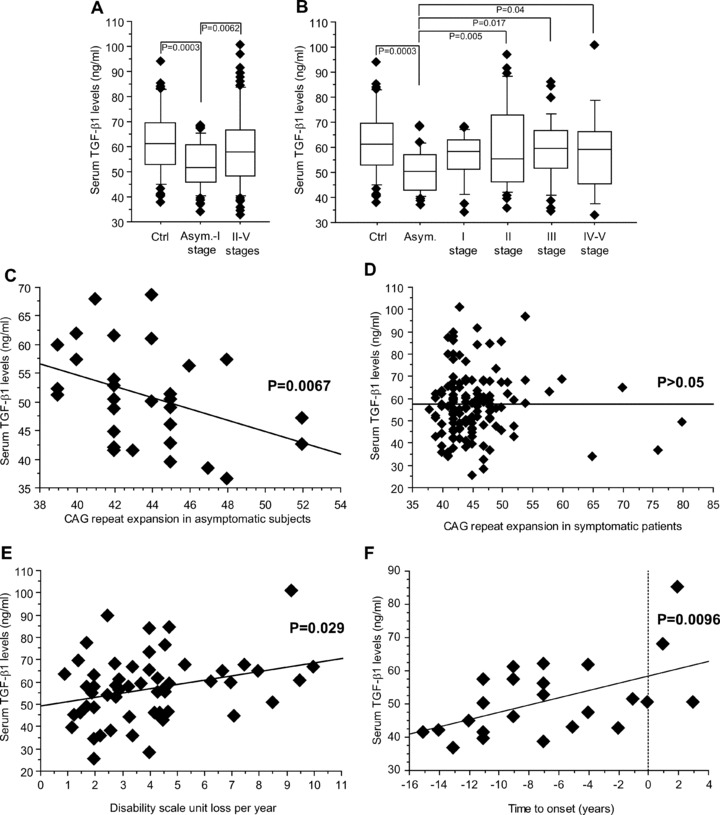
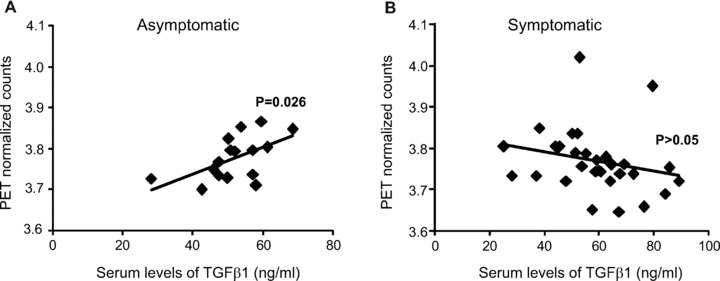
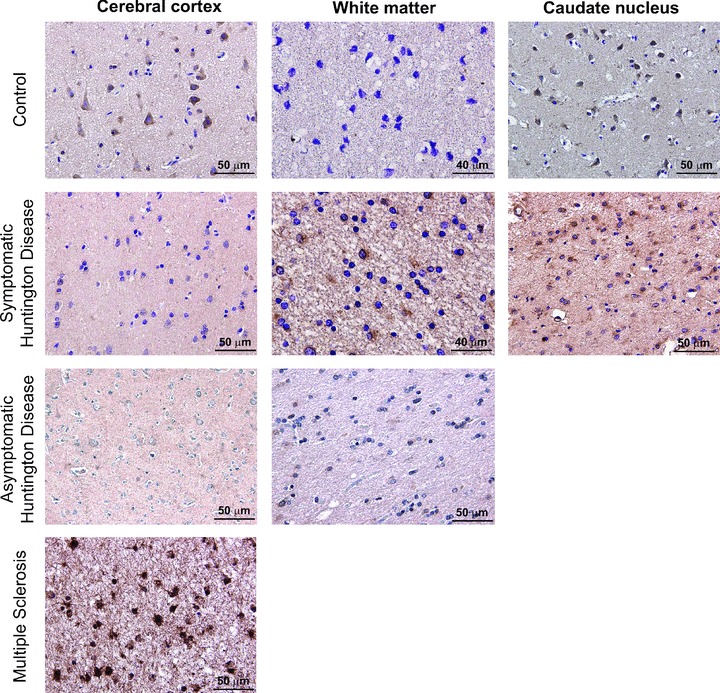
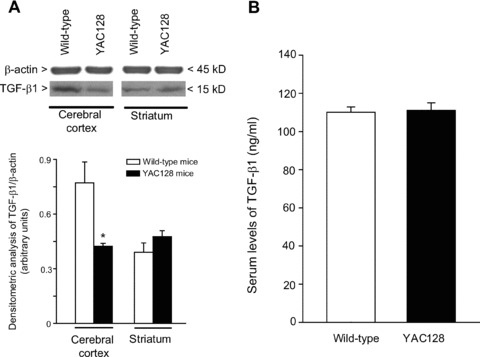
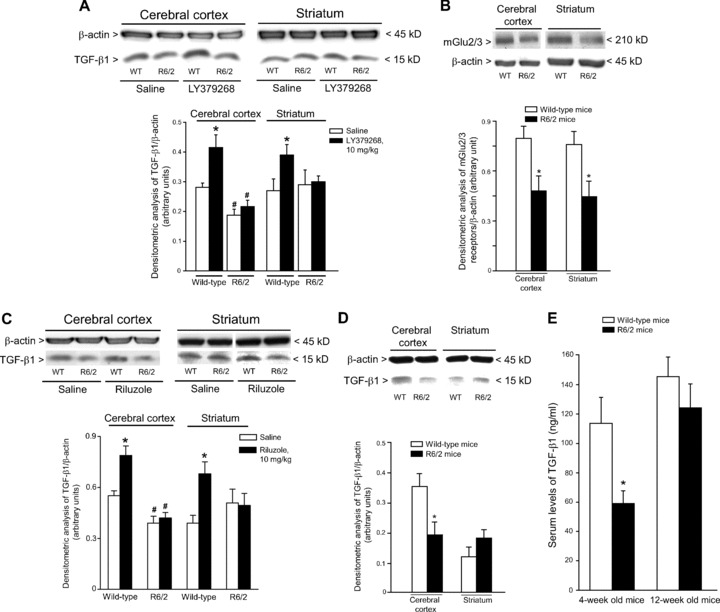
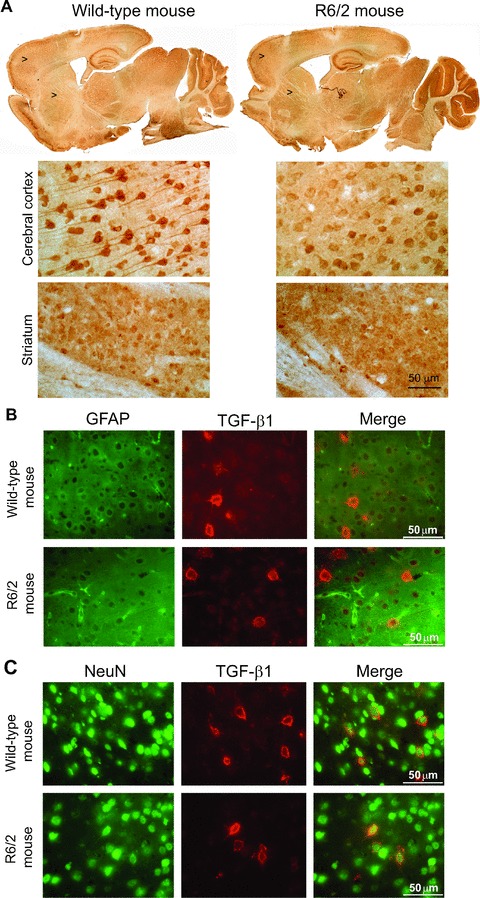
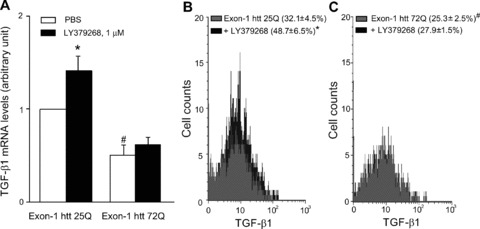
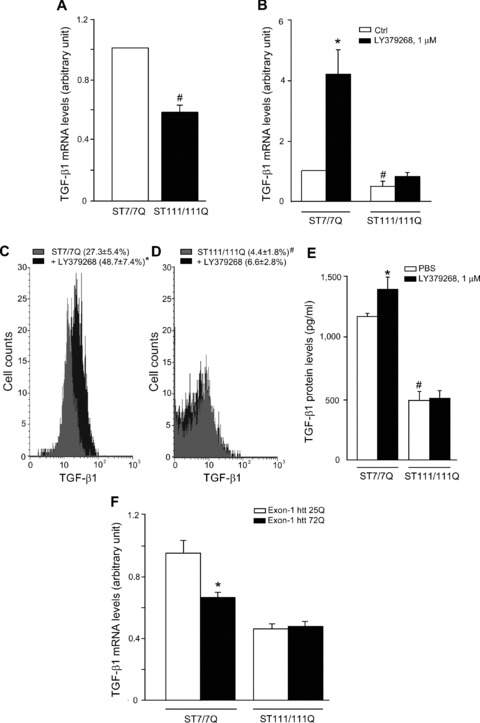
A defective expression or activity of neurotrophic factors, such as brain- and glial-derived neurotrophic factors, contributes to neuronal damage in Huntington's disease (HD). Here, we focused on transforming growth factor-β (TGF-β(1) ), a pleiotropic cytokine with an established role in mechanisms of neuroprotection. Asymptomatic HD patients showed a reduction in TGF-β(1) levels in the peripheral blood, which was related to trinucleotide mutation length and glucose hypometabolism in the caudate nucleus. Immunohistochemical analysis in post-mortem brain tissues showed that TGF-β(1) was reduced in cortical neurons of asymptomatic and symptomatic HD patients. Both YAC128 and R6/2 HD mutant mice showed a reduced expression of TGF-β(1) in the cerebral cortex, localized in neurons, but not in astrocytes. We examined the pharmacological regulation of TGF-β(1) formation in asymptomatic R6/2 mice, where blood TGF-β(1) levels were also reduced. In these R6/2 mice, both the mGlu2/3 metabotropic glutamate receptor agonist, LY379268, and riluzole failed to increase TGF-β(1) formation in the cerebral cortex and corpus striatum, suggesting that a defect in the regulation of TGF-β(1) production is associated with HD. Accordingly, reduced TGF-β(1) mRNA and protein levels were found in cultured astrocytes transfected with mutated exon 1 of the human huntingtin gene, and in striatal knock-in cell lines expressing full-length huntingtin with an expanded glutamine repeat. Taken together, our data suggest that serum TGF-β(1) levels are potential biomarkers of HD development during the asymptomatic phase of the disease, and raise the possibility that strategies aimed at rescuing TGF-β(1) levels in the brain may influence the progression of HD.


Figures

Fig 1
Fig 1
Serum TGF-β1 levels in HD patients. Reduced serum TGF-β1 levels in asymptomatic and stage-I HD patients (A). TGF-β1 levels in control (Ctrl) and all life stage patients are shown in (B). Statistical analysis was carried out by Student’s t-test in (A) and by one-way anova+ Fisher PLSD in (B). Linear dependence of serum TGF-β1 levels on expanded CAG repeat number in asymptomatic patients is shown in (C) (n= 30, R2= 0.16, P= 0.0067). The lack of correlation between serum TGF-β1 levels and the number of expanded CAG repeats in symptomatic patients is shown in (D). (E) Patients with disease length beyond 5 years and manifest HD (stages II-V) showed a slight but significant linear dependence of serum TGF-β1 levels on the rate of progression of the disease, calculated as loss of units of the DS per year (n= 54, R2= 0.10, P= 0.029). (F) Serum TGF-β1 in asymptomatic mutation carriers, whose predicted age at onset was estimated within further 15 years, showed an increase linearly correlating with the estimated time to onset (n= 24, R2= 0.27, P= 0.0096, simple regression analysis). The few patients with estimated time to onset higher than 0 on x-axis showed an age in years delayed to that expected on the basis of their CAG size.
Fig 2
Fig 2
Correlation between serum TGF-β1 levels and glucose metabolism in patients at asymptomatic and symptomatic HD stages. The relation between serum TGF-β1 levels and glucose metabolism in the caudate nucleus of asymptomatic and symptomatic HD patients is shown in (A) and (B), respectively. Note that a positive correlation is found only in asymptomatic patients (n= 23, R2= 0.31, P= 0.026).
Fig 3
Fig 3
TGF-β1 Immunohistochemistry in post-mortem brain samples of HD and non-HD patients. Immunohistochemistry for TGF-β1 in representative post-mortem samples of the cerebral cortex, white matter and caudate nucleus of a control patient, a symptomatic patient, an asymptomatic patient and a patient with multiple sclerosis. Note the substantial loss of TGF-β1 in cortical neurons of the asymptomatic patient.
Fig 4
Fig 4
TGF-β1 in transgenic YAC128 mice brain and peripheral serum. Immunoblot analysis of TGF-β1 in the cerebral cortex and striatum of wild-type and asymptomatic YAC128 mice (8 weeks of age) is shown in (A). Densitometric values are means ± S.E.M. of five to seven determinations. *P < 0.05 (Student’s t-test) versus the corresponding values obtained in wild-type mice. Serum TGF-β1 levels in wild-type and asymptomatic YAC128 mice are shown in (B), where values are means ± S.E.M. of five to seven determinations.
Fig 5
Fig 5
TGF-β1 levels in the cerebral cortex, striatum, and peripheral blood of asymptomatic or symptomatic R6/2 mice. Immunoblot analysis of TGF-β1 in the cerebral cortex and striatum of wild-type, and asymptomatic (4 weeks of age) R6/2 mice is shown in (A). Mice were also treated with a single i.p. injection of saline or LY379268 (10 mg/kg). Values are means ± S.E.M. of six determinations. P < 0.05 versus the respective values obtained in mice treated with saline (*) or versus the respective values obtained in wild-type mice (#) (one-way anova+ Fisher’s PLSD). A representative immunoblot is also shown. Immunoblot analysis of mGlu2/3 receptors in the cerebral cortex and striatum of asymptomatic R6/2 mice is shown in (B), where values are means ± S.E.M. of six determinations. *P < 0.05 versus the respective values obtained in wild-type mice (Student’s t-test). Immunoblot analysis of TGF-β1 in the cerebral cortex and striatum of wild-type and asymptomatic R6/2 mice treated with a single i.p. injection of saline or riluzole (10 mg/kg) is shown in (C). Values are means ± S.E.M. of five to six determinations. P < 0.05 versus the respective values obtained in mice treated with saline (*) or versus the respective values obtained in wild-type mice (#) (one-way anova+ Fisher’s PLSD). Immunoblot analysis of TGF-β1 in the cerebral cortex and striatum of wild-type and symptomatic (12 weeks of age) R6/2 mice is shown in (D). Values are means + S.E.M. of five to six determinations. *P < 0.05 (Student’s t-test) versus the respective values obtained in age matched wild-type mice. Serum TGF-β1 levels in wild-type, asymptomatic and symptomatic R6/2 mice are shown in (E), where values are means + S.E.M. of six determinations. P < 0.05 versus values obtained in age-matched wild-type mice (*) (Student’s t-test).
Fig 6
Fig 6
Immunohistochemical analysis of TGF-β1 in wild-type and asymptomatic R6/2 mice. Immunohistochemical analysis of TGF-β1 in a representative wild-type and asymptomatic R6/2 mouse is shown in (A). Arrowheads indicate the zone showed at higher magnification. Double fluorescent staining for TGF-β1 and GFAP, or TGF-β1 and NeuN in cortical neurons of a representative wild-type and asymptomatic R6/2 mouse is shown in (B) and (C), respectively. Note that TGF-β1 is expressed in neurons and not in astrocytes.
Fig 7
Fig 7
Analysis of TGF-β1 in astrocytes expressing exon-1 htt 72Q. Real Time RT-PCR of TGF-β1 mRNA analysis (A) and FACS analysis of intracellular TGF-β1 protein (B, C) in astrocytes transfected with exon-1 of human huntingtin (htt) containing an expanded 72Q repeat or an unexpanded 25Q repeat used as a control, under basal conditions and after treatment with LY379268, 1 μM for 10 min. The mean fluorescence intensity (MFI) of TGF-β1 in astrocytes transfected with exon-1 htt 25Q or exon-1 htt 72Q and treated with PBS or LY379268 was unchanged (MFI: 22.4 ± 5.8, 22.1 ± 5.7, 24.5 ± 6.7, 20.6 ± 6.3, respectively). Values are means ± S.E.M. of five to six determinations. P < 0.05 versus the respective values obtained in transfected astrocytes treated with PBS (*) or versus the respective values obtained in astrocytes transfected with exon-1 htt 25Q (#) (one-way anova+ Fisher’s PLSD).
Fig 8
Fig 8
Analysis of TGF-β1 in striatal-derived knock-in cells expressing full-length huntingtin with an expanded Q repeat. Real Time RT-PCR of TGF-β1 mRNA analysis (A, B) in ST7/7Q, wild-type cells or full-length mutated huntingtin ST111/111Q, mhtt cells, under basal conditions and after treatment with LY379268, 1 μM for 10 min. FACS analysis of intracellular TGF-β1 protein (C) and ELISA analysis of extracellular TGF-β1 protein wild-type and mhtt cells, under basal conditions and after treatment with LY379268, 1 μM for 10 min (D). The mean fluorescence intensity (MFI) of TGF-β1 in ST7/7Q cells (MFI: 18.1 ± 4.3, 18.0 ± 5.6, respectively) or in ST111/111Q cells (MFI: 27.3 ± 7.3, 18.0 ± 8.0, respectively) treated with PBS or LY379268 was unchanged (E). Values are means ± S.E.M. of five to six determinations. P < 0.05 versus the respective values obtained in wild-type cells treated with LY379268 (*) or versus the respective values obtained in ST7/7Q cells (#) (one-way anova+ Fisher’s PLSD). Real Time RT-PCR of TGF-β1 mRNA analysis (F) in ST7/7Q and ST111/111Q knock-in cells transfected with the unexpanded exon-1 htt 25Q or the expanded exon-1 htt 72Q. Values are means ± S.E.M. of five to six determinations. P < 0.05 versus the respective values obtained in ST7/7Q cells transfected with exon-1 htt 25Q (one-way anova+ Fisher’s PLSD).

Similar articles

Cited by

References

    1. Sathasivam K, Hobbs C, Turmaine M, et al. Formation of polyglutamine inclusions in non-CNS tissue. Hum Mol Genet. 1999;8:813–22. - PubMed
    1. The Huntington’s Disease Collaborative Research Group. A novel gene containing a trinucleotide repeat that is expanded and unstable on Huntington’s disease chromosomes. Cell. 1993;72:971–83. - PubMed
    1. Vonsattel JP, Myers RH, Stevens TJ, et al. Neuropathological classification of Huntington’s disease. J Neuropathol Exp Neurol. 1985;44:559–77. - PubMed
    1. de la Monte SM, Vonsattel JP Richardson EPJr. Morphometric demonstration of atrophic changes in the cerebral cortex, white matter, and neostriatum in Huntington’s disease. J Neuropathol Exp Neurol. 1988;47:516–25. - PubMed
    1. Beal MF, Kowall NW, Ellison DW, et al. Replication of the neurochemical characteristics of Huntington’s disease by quinolinic acid. Nature. 1986;321:168–71. - PubMed

Publication types

MeSH terms