

Ribonucleotide and ribonucleoside determination by ambient pressure ion mobility spectrometry
- PMID: 20082780
- PMCID: PMC2898576
- DOI: 10.1016/j.aca.2009.10.058
Ribonucleotide and ribonucleoside determination by ambient pressure ion mobility spectrometry
Abstract
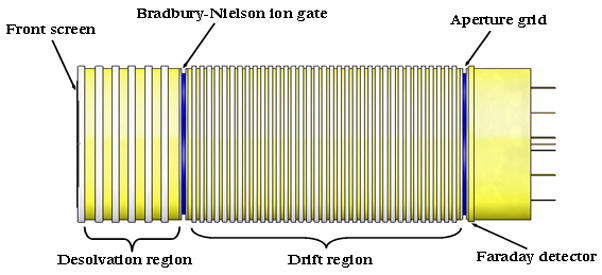
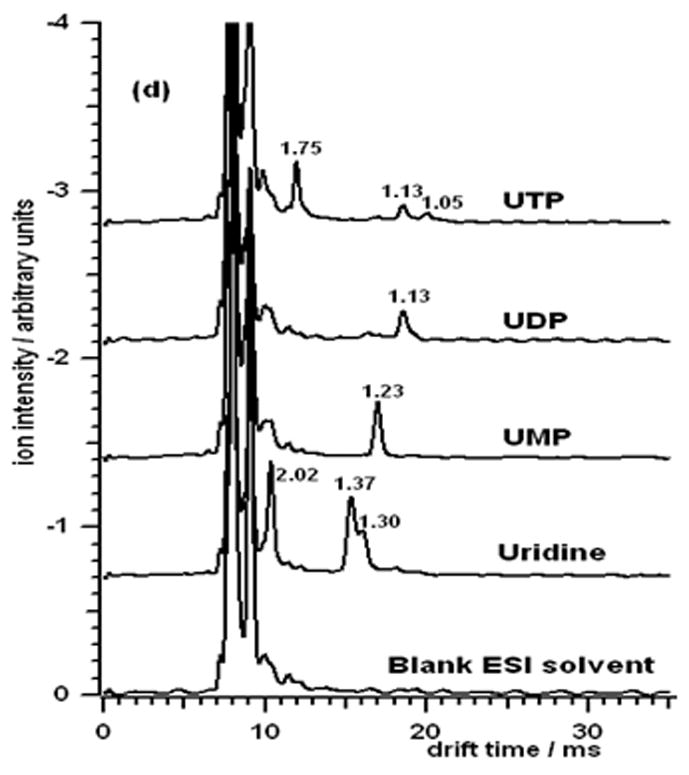
Detection limits and reduced mobilities for 12 ribonucleotides and 4 ribonucleosides were measured by ambient pressure electrospray ionization-ion mobility spectrometry (ESI-IMS). With the instrument used in this study it was possible to separate some of these compounds within mixtures. Detection limits reported for ribonucleotides and ribonucleosides ranged from 15 to 300 pmol and the reduced mobilities ranged from 41 to 56 suggesting that ambient pressure ESI-IMS may be used for their rapid and sensitive separation and detection. This report demonstrates that it was possible to use ion mobility spectrometry (IMS) to obtain a spectrum for the separation of nucleotides and nucleosides in less than 1 min. The application holds great promise for nucleotide analysis in the area of separating DNA fragments in genome sequencing and also for forensics DNA typing examinations used for the identification of blood stains in crime scenes and paternity testing.
Copyright 2009. Published by Elsevier B.V.
Figures


Similar articles
-
Direct analysis of pharmaceutical drug formulations using ion mobility spectrometry/quadrupole-time-of-flight mass spectrometry combined with desorption electrospray ionization.Anal Chem. 2005 Dec 1;77(23):7572-80. doi: 10.1021/ac051277q. Anal Chem. 2005. PMID: 16316164
-
Commercial intermediate pressure MALDI ion mobility spectrometry mass spectrometer capable of producing highly charged laserspray ionization ions.Anal Chem. 2011 Feb 1;83(3):678-84. doi: 10.1021/ac102779e. Epub 2010 Dec 17. Anal Chem. 2011. PMID: 21166462
-
An ion mobility/ion trap/photodissociation instrument for characterization of ion structure.J Am Soc Mass Spectrom. 2011 Sep;22(9):1477-85. doi: 10.1007/s13361-011-0179-8. Epub 2011 Jul 9. J Am Soc Mass Spectrom. 2011. PMID: 21953250
-
Nucleosides and nucleotides: natural bioactive substances in milk and colostrum.Br J Nutr. 2000 Nov;84 Suppl 1:S59-68. doi: 10.1017/s0007114500002269. Br J Nutr. 2000. PMID: 11242448 Review.
-
Electrospray Ionization Ion Mobility Mass Spectrometry.Crit Rev Anal Chem. 2023;53(3):483-497. doi: 10.1080/10408347.2021.1964938. Epub 2021 Sep 22. Crit Rev Anal Chem. 2023. PMID: 34547945 Review.
Cited by
-
Advancements in the characterisation of oligonucleotides by high performance liquid chromatography-mass spectrometry in 2021: A short review.Anal Sci Adv. 2022 Apr 10;3(3-4):90-102. doi: 10.1002/ansa.202100066. eCollection 2022 Apr. Anal Sci Adv. 2022. PMID: 38715636 Free PMC article. Review.
-
Review of fragmentation of synthetic single-stranded oligonucleotides by tandem mass spectrometry from 2014 to 2022.Rapid Commun Mass Spectrom. 2023 Sep 15;37(17):e9596. doi: 10.1002/rcm.9596. Rapid Commun Mass Spectrom. 2023. PMID: 37580500 Free PMC article. Review.
-
Qualitative and Quantitative Analytical Techniques of Nucleic Acid Modification Based on Mass Spectrometry for Biomarker Discovery.Int J Mol Sci. 2024 Mar 16;25(6):3383. doi: 10.3390/ijms25063383. Int J Mol Sci. 2024. PMID: 38542356 Free PMC article. Review.
References
-
- Li D-F, Li J, Ma L, Zhang L, Lu Y-T. FEBS Letters. 2006;580:4325. - PubMed
-
- Zhou J, Low PS. J Biol Chem. 2001;276:38147. - PubMed
-
- Cok SJ, Acton SJ, Sexton AE, Morrison AR. J Biol Chem. 2004;279:8196. - PubMed
-
- Koomen JN, Russell WK, Tichy SE, Russell DH. J Mass Spectrom. 2002;37:357. - PubMed
-
- Hofstadler SA, Griffey RH. Chem Rev. 2001;101:377. - PubMed
Publication types
MeSH terms
Substances
Grants and funding
LinkOut - more resources
Full Text Sources
