. 2010 May;48(5):943-53.
doi: 10.1016/j.yjmcc.2010.01.004. Epub 2010 Jan 18.

Calcium sensitivity, force frequency relationship and cardiac troponin I: critical role of PKA and PKC phosphorylation sites

Affiliations

Calcium sensitivity, force frequency relationship and cardiac troponin I: critical role of PKA and PKC phosphorylation sites

Genaro A Ramirez-Correa et al. J Mol Cell Cardiol. 2010 May.

Abstract

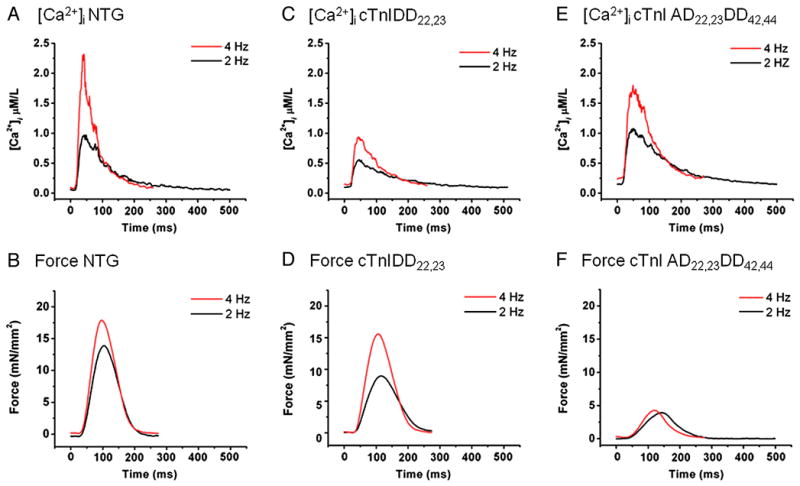
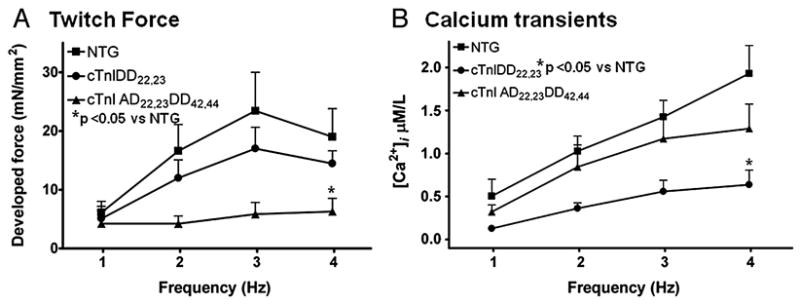
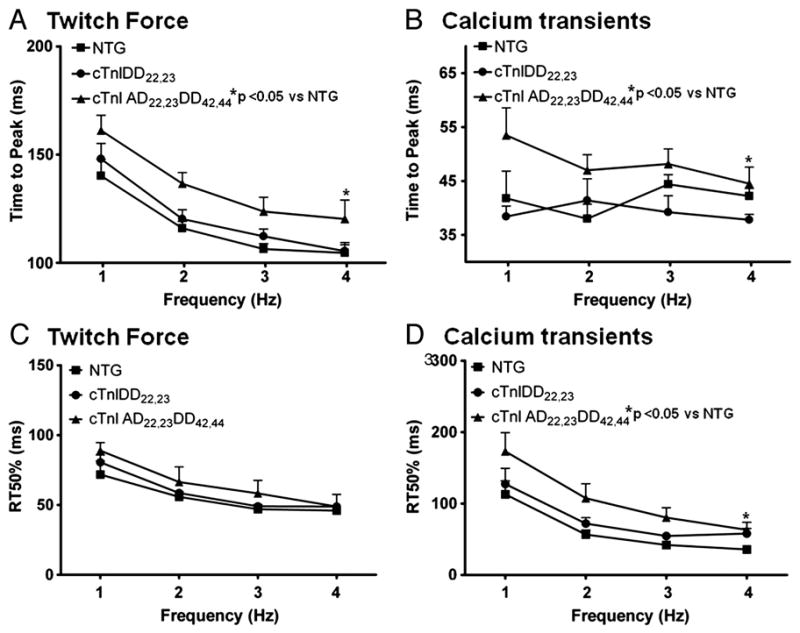
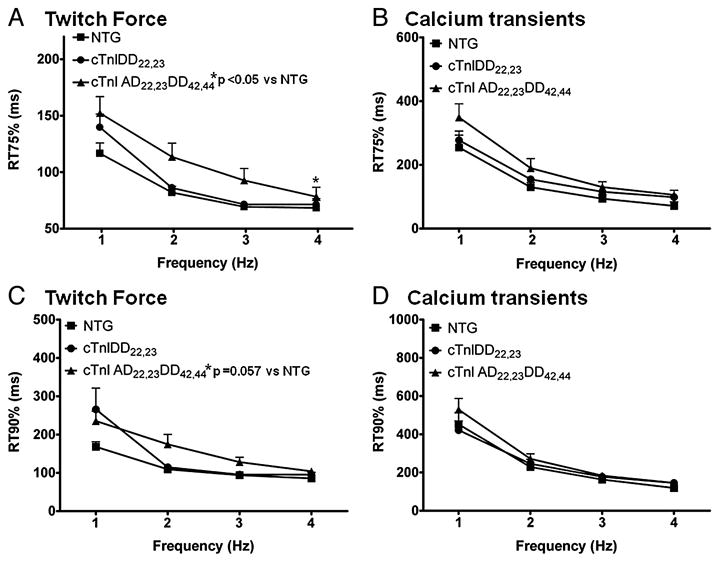
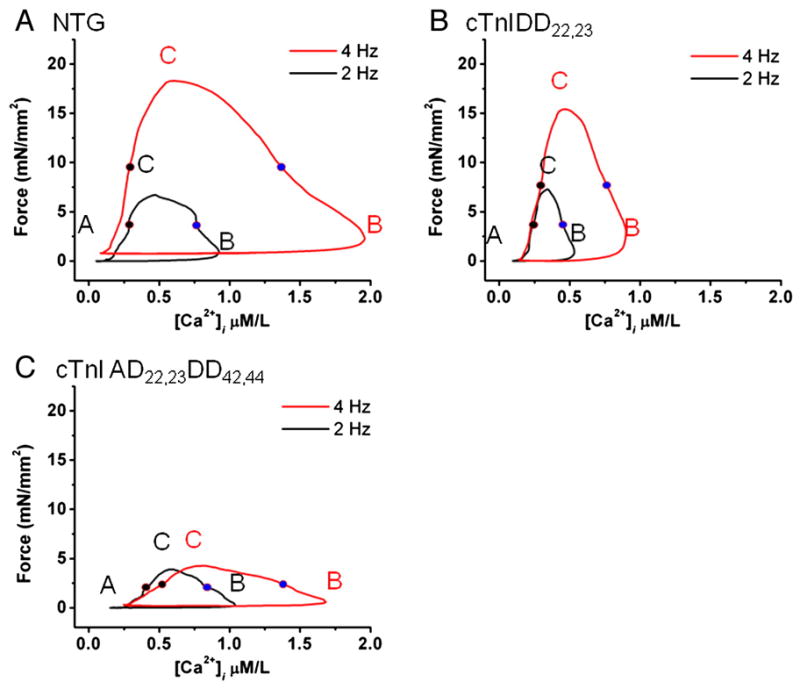
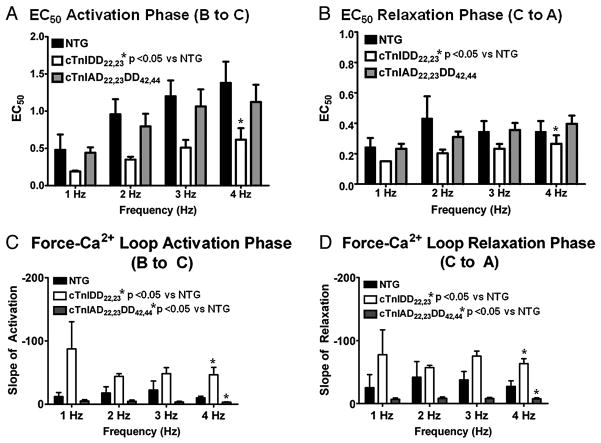
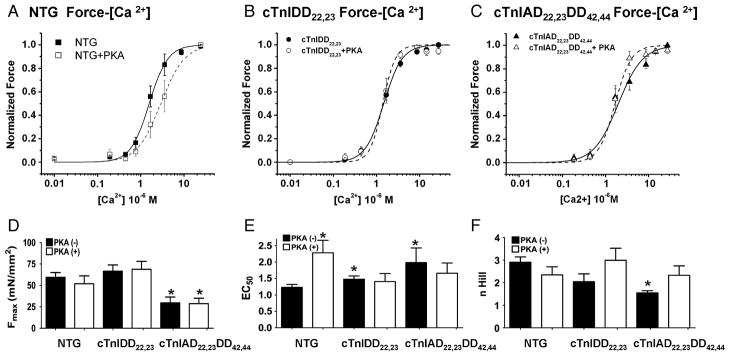
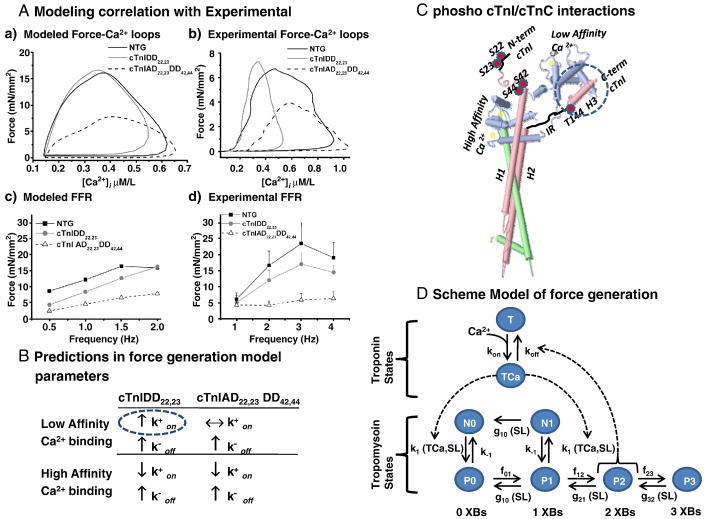
Transgenic models with pseudo phosphorylation mutants of troponin I, PKA sites at Ser 22 and 23 (cTnIDD(22,23) mice) or PKC sites at Ser 42 and 44 (cTnIAD(22,23)DD(42,44)) displayed differential force-frequency relationships and afterload relaxation delay in vivo. We hypothesized that cTnI PKA and PKC phosphomimics impact cardiac muscle rate-related developed twitch force and relaxation kinetics in opposite directions. cTnIDD(22,23) transgenic mice produce a force frequency relationship (FFR) equivalent to control NTG albeit at lower peak [Ca(2+)](i), while cTnIAD(22,23)DD(42,44) TG mice had a flat FFR with normal peak systolic [Ca(2+)](i), thus suggestive of diminished responsiveness to [Ca(2+)](i) at higher frequencies. Force-[Ca(2+)](i) hysteresis analysis revealed that cTnIDD(22,23) mice have a combined enhanced myofilament calcium peak response with an enhanced slope of force development and decline per unit of [Ca(2+)](i), whereas cTnIAD(22,23)DD(42,44) transgenic mice showed the opposite. The computational ECME model predicts that the TG lines may be distinct from each other due to different rate constants for association/dissociation of Ca(2+) at the regulatory site of cTnC. Our data indicate that cTnI phosphorylation at PKA sites plays a critical role in the FFR by increasing relative myofilament responsiveness, and results in a distinctive transition between activation and relaxation, as displayed by force-[Ca(2+)](i) hysteresis loops. These findings may have important implications for understanding the specific contribution of cTnI to beta-adrenergic inotropy and lusitropy and to adverse contractile effects of PKC activation, which is relevant during heart failure development.


Figures

Figure 1
Figure 1. Examples of tracings of Twitch Force and Ca2+ Transients from isolated trabeculae stimulated at 2 and 4 Hz
On the top panel, examples of Ca2+ transients at 2 Hz (black) and 4Hz (red) are shown for NTG (A), cTnIDD22,23 (C) and cTnIAD22,23DD42,44 (D), notice the smaller amplitude of cTnIDD22,23 Ca2+ transients, which show similar kinetics of relaxation. On the bottom panel, examples of twitch force tracings at 2 Hz (black) and 4Hz (red) are shown for NTG (B), cTnIDD22,23 (D) and cTnIAD22,23DD42,44 (F). Observe that cTnIAD22,23DD42,44 failed to increase force at increased frequency.
Figure 2
Figure 2. Developed Force and Ca2+ Transients during Force-Frequency Response
A, Shows averaged maximum twitch developed force at various stimulation frequencies (1, 2, 3 and 4 Hz) from NTG (n=8), cTnIDD22,23 (n=7) and cTnIAD22,23DD42,44 (n=7) mice. Force-Frequency Response was positive in NTG and cTnIDD22,23, whereas in cTnIAD22,23DD42,44 group there was not a significant increase of force with frequency. cTnIAD22,23DD42,44 showed statistical difference when compared to NTG (*p < 0.05 two-way RM ANOVA). B, Shows averaged Ca2+ transients corresponding to twitch force at same range of stimulation frequencies (1–4Hz). NTG (n=5), cTnIDD22,23 (n=4) and cTnIAD22,23DD42,44 (n=6) mice. Contrary to Force, Ca2+ transients from all three mice groups increased with frequency, although cTnIDD22,23 mice showed an overall significant difference when compared to NTG (*p < 0.05 two-way RM ANOVA). All data are expressed as means± s.e.m.
Figure 3
Figure 3. Relaxation time to 50% in Twitch Force and Ca2+ Transients Kinetics during Force-Frequency Response
A, Twitch force kinetics showing time to peak (TTP) for NTG (n=5), cTnIDD22,23 (n=7) and cTnIAD22,23DD42,44 (n=7) mice, which accelerates as frequency increases from 1 to 4Hz. cTnIAD22,23DD42,44 was significantly slower than NTG (*p<0.05 two-way RM ANOVA). B, Corresponding TTP from Ca2+ transients NTG (n=5), cTnIDD22,23 (n=4) and cTnIAD22,23DD42,44 (n=6) mice, which does not accelerate in response to frequency increase, cTnIAD22,23DD42,44 was significantly slower than NTG (*p<0.05 two-way RM ANOVA). C, Twitch force kinetics showing relaxation time from peak to 50% (RT50) for corresponding mice groups. A positive frequency-dependent acceleration of relaxation (FDAR) is evident in all mice groups from 1 to 4 Hz (one-way ANOVA *p<0.05), however there were no differences between genotypes. D, Shows corresponding Relaxation time from peak to 50% (RT50) from Ca2+ transients at same range of stimulation frequencies. Ca2+ transients RT50% also showed a positive frequency-dependent acceleration of relaxation in all of the mice groups (one-way ANOVA *p<0.05). Genotype cTnIAD22,23DD42,44 showed an overall effect with slowed calcium transient kinetics of decay at RT50% (*p<0.05 two-way RM ANOVA).
Figure 4
Figure 4. Relaxation time to 75% and 90% on Twitch Force and Ca2+ Transients during FFR in NTG and TG models
A, C Twitch force kinetics showing relaxation time from peak to 75% (RT75) and time from peak to 90% (RT90), respectively, for NTG (n=5), cTnIDD22,23 (n=7) and cTnIAD22,23DD42,44 (n=7) mice. As for other relaxation parameters, a positive FDAR is evident in all mice groups from 1 to 4 Hz. Genotype cTnIAD22,23DD42,44 showed an overall effect on slowing twitch kinetics at RT75% (*p<0.05), and a strong trend at RT90% (p=0.057) by two-way RM ANOVA. B, D Corresponding Ca2+ transients Relaxation time from peak 75% (RT75) and time from peak to 90% (RT90), respectively, NTG (n=5), cTnIDD22,23 (n=4) and cTnIAD22,23DD42,44 (n=6) mice. A positive FDAR was also evident in all groups from 1 to 4 Hz (one-way ANOVA *p<0.05). No difference was evident between groups.
Figure 5
Figure 5. Phase plane analyses of force-[Ca2+]i loops in NTG and TG lines
Examples of twitch forces vs. corresponding [Ca2+]i are shown at 2 Hz (black) and 4Hz (red) (1.5mM [Ca2+]o) in NTG, cTnIDD22,23 and cTnIAD22,23DD42,44 trabecular muscles. In the phase-plane analysis segments are indicated by letters A (rest), B (maximum [Ca2+]i) and C (maximum developed force). ECa50 of activation is depicted as blue filled circles while ECa50 of relaxation as black filled circles. Note the distinctive Force-[Ca2+]i hysteresis loops and ECa50. A, NTG shows that force-[Ca2+]i hysteresis loop is amplified with increased frequency, segment B and C are shifted to the right and upwards, respectively. ECa50 at 2Hz and 4Hz was 0.96±0.2 and 1.38±0.29 μM, respectively. B, cTnIDD22,23 force-[Ca2+]i hysteresis loop is modified at baseline and increase in frequency shifted point B modestly, while point C (maximal force) is preserved. ECa50 at 2Hz and 4Hz was 0.35±0.04 and 0.62±0.15 μM, respectively. C, cTnIAD22,23DD42,44 displays abnormal force-[Ca2+]i hysteresis loop, at 2 Hz transitions between B and C are less steep and the increase in frequency shifts point B rightward but does not shift point C (maximal developed force), thus the slopes of transition between B and C (force activation) and C to A (relaxation phase) are further compromised. ECa50 of activation at 2Hz and 4Hz was 0.80±0.17 and 1.12±0.23 μM, respectively.
Figure 6
Figure 6. Comparison of EC50 and slopes or force-[Ca2+]i loops activation and relaxation in NTG and TG lines
Slopes of activation and relaxation were calculated dissecting individual segments and fitting for linearity, here mid-point of activation or relaxation, as well as slope steepness was group averaged (n= 3–5 per line) and compared. A, Comparison of EC50 of activation phase (B to C segment) showed a frequency-dependent increase of EC50 in all groups, indicating a general frequency-dependent myofilament calcium desensitization, however, cTnIDD22,23 was relatively desensitized when compared to NTG (*p<0.001 by two-way ANOVA). B, Comparison of EC50 of relaxation phase (C to A segment) showed no dependence on frequency, however, cTnIDD22,23 EC50 was consistently desensitized when compared to NTG (*p<0.05 by two-way ANOVA). C, Comparison of steepness of Slopes of activation (B to C segment) reveal an increased slope in cTnIDD22,23 when compare to NTG (*p<0.001 by two-way ANOVA), on the contrary cTnIAD22,23DD42,44 displayed a decreased slope when compared to NTG (*p<0.05 by two-way ANOVA). D, Similarly, comparison of slopes of relaxation showed a marked increase in steepness in cTnIDD22,23 transition from C to A, when compare to NTG (*p<0.005 by two-way ANOVA), and a decreased slope in cTnIAD22,23DD42,44 when compared to NTG (*p<0.05 by two-way ANOVA).
Figure 7
Figure 7. Steady-State Force-Calcium Relationships in Skinned Fibers of NTG, cTnIDD22,23, cTnI PKA/PKC
A, Freshly isolated trabeculae were skinned and exposed to various concentrations of calcium. NTG Control (n=6) PKA (−) solid lines, trabecuale were then washed in relaxing solution and incubated 1hr in relaxing solution containing 30 Units of PKA, then a new calcium activation protocol was carried out, NTG PKA (+) dashed lines (n=4). Same procedure was repeated B) for cTnIDD22,23 (n=5) and C) for cTnIAD22,23DD42,44 (n=5). D) Fmax comparison between NTG and TG models, cTnIAD22,23DD42,44 showed a significant reduction of force when compared with NTG (*p<0.05). E) ECa50 comparison between NTG and TG models. cTnIDD22,23 and cTnIAD22,23DD42,44 showed baseline desensitization compared to NTG. Only NTG skinned tabeculae showed a significant rightward shift after exposure to PKA (*p<0.05). F) Hill coefficient (n) comparison between NTG and TG models. cTnIAD22,23DD42,44 showed a significant reduction of cooperativity when compared with NTG (*p<0.05).
Figure 8
Figure 8. Computational model
A, Computational Modeling simulation correlate with experimental results; a) Force-[Ca2+]i Loops at 2Hz and c) Force Frequency Relationship 0.5 to 2 Hz compared to corresponding experimental results, because ECME model does not extrapolate to 4Hz b) Force-[Ca2+]i at 2Hz and d) FFR 1 to 4 Hz. The ECME modeling was able to closely resemble the experimental FFR genotypes for both TG models, in particular close resemblance was displayed for experimental Force-[Ca2+]i loops of cTnIAD22,23DD42,44 genotype, however notice the different scales in frequency and [Ca2+]i. B, Summary of force generation parameters and changes predicted to impact force and calcium, cTnIDD22,23 distinctive increase in association constants to low affinity site is highlighted by a blue dashed circle. Lack of increase in the latter constant in cTnIAD22,23DD42,44. is the only parameter different from cTnIDD22,23, however simulation outcome greatly diverges. Results suggest that an increase in association-dissociation constants for high affinity Ca2+ sites are critical for successful computational modeling in both TG genotypes. Arrows express changes relative to NTG. C, Representation of phosphorylation sites on cTnI and regional interactions cTnC. Troponin complex structure molecular model, color coding of TnI (light pink), N-terminal domain and inhibitory region are schematically represented in thick black lines, phosphorylated sites are enumerated and highlighted in red circles, cTnT (light green), cTnC (light blue), Ca2+ ions (light yellow), cTnI C-Term/cTnC-N-term interactions highlighted by a blue dashed circle. Phosphorylation status of cTnI is thought to influence allosteric interactions with cTnC hydrophobic patch [33]. Troponin complex structure, PDB ID: 1J1D [53] was modeled using PDB Jmol Version 11.8.4. C, Schematic representation of model used in force generation. Troponin complex on and off rate constants (k) of Ca2+ influence tropomyosin transition states N0 to P0 and N1 to P1, P2 feeds-back to Ca2+ K off from troponin (modified from Cortassa S et al [24]).

Similar articles

Cited by

References

    1. Allen DG, Blinks JR. Calcium transients in aequorin-injected frog cardiac muscle. Nature. 1978 Jun 15;273(5663):509–13. - PubMed
    1. Wier WG, Yue DT. Intracellular calcium transients underlying the short-term force-interval relationship in ferret ventricular myocardium. The Journal of physiology. 1986 Jul;376:507–30. - PMC - PubMed
    1. Gao WD, Perez NG, Marban E. Calcium cycling and contractile activation in intact mouse cardiac muscle. The Journal of physiology. 1998 Feb 15;507( Pt 1):175–84. - PMC - PubMed
    1. Layland J, Kentish JC. Positive force- and [Ca2+]i-frequency relationships in rat ventricular trabeculae at physiological frequencies. Am J Physiol. 1999 Jan;276(1 Pt 2):H9–H18. - PubMed
    1. Endoh M. Force-frequency relationship in intact mammalian ventricular myocardium: physiological and pathophysiological relevance. Eur J Pharmacol. 2004 Oct 1;500(1–3):73–86. - PubMed

Publication types