

Liquid chromatography-mass spectrometry (LC-MS) of steroid hormone metabolites and its applications
- PMID: 20083198
- PMCID: PMC2894289
- DOI: 10.1016/j.jsbmb.2010.01.005
Liquid chromatography-mass spectrometry (LC-MS) of steroid hormone metabolites and its applications
Abstract
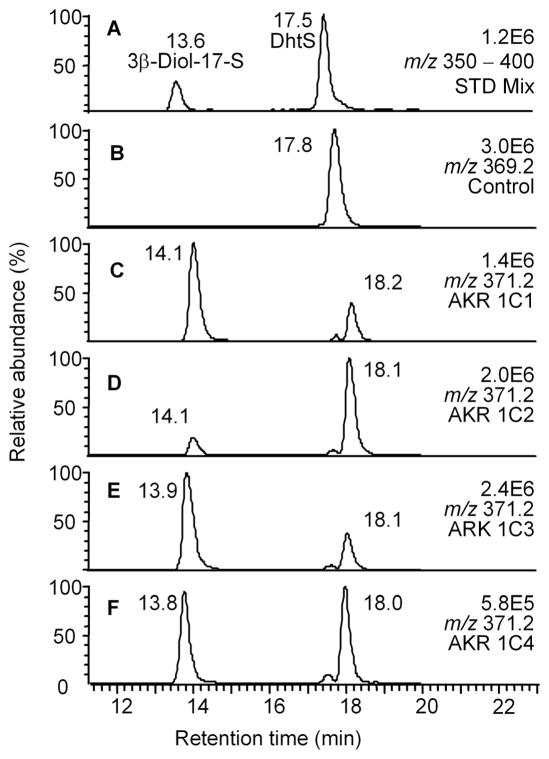
Advances in liquid chromatography-mass spectrometry (LC-MS) can be used to measure steroid hormone metabolites in vitro and in vivo. We find that LC-electrospray ionization (ESI)-MS using a LCQ ion trap mass spectrometer in the negative ion mode can be used to monitor the product profile that results from 5alpha-dihydrotestosterone (DHT)-17beta-glucuronide, DHT-17beta-sulfate, and tibolone-17beta-sulfate reduction catalyzed by human members of the aldo-keto reductase (AKR) 1C subfamily and assign kinetic constants to these reactions. We also developed a stable isotope dilution LC-electron capture atmospheric pressure chemical ionization (ECAPCI)-MS method for the quantitative analysis of estrone (E1) and its metabolites as pentafluorobenzyl (PFB) derivatives in human plasma in the attomole range. The limit of detection for E1-PFB was 740attomole on column. Separations can be performed using normal-phase LC because ionization takes place in the gas phase rather than in solution. This permits efficient separation of the regioisomeric 2- and 4-methoxy-E1. The method was validated for the simultaneous analysis of plasma E2 and its metabolites: 2-methoxy-E2, 4-methoxy-E2, 16alpha-hydroxy-E2, estrone (E1), 2-methoxy-E1, 4-methoxy-EI, and 16alpha-hydroxy-E1 from 5pg/mL to 2000pg/mL. Our LC-MS methods have sufficient sensitivity to detect steroid hormone levels in prostate and breast tumors and should aid their molecular diagnosis and treatment.
Copyright 2010 Elsevier Ltd. All rights reserved.
Figures


References
-
- Moal V, Mathieu E, Reynier P, Malthièry Y, Gallois Y. Low serum testosterone assayed by liquid chromatography-tandem mass spectrometry. Comparison with five immunoassay techniques. Clin Chim Acta. 2007;386(1–2):12–9. - PubMed
-
- Thienpont LM, Van Uytfanghe K, Blincko S, Ramsay CS, Xie H, Doss RC, Keevil BG, Owen LJ, Rockwood AL, Kushnir MM, Chun KY, Chandler DW, Field HP, Sluss PM. State-of-the-art of serum testosterone measurement by isotope dilution-liquid chromatography-tandem mass spectrometry. Clin Chem. 2008;54(8):1290–7. - PubMed
-
- Wang C, Catlin CH, Demers LM, Starcevic B, Swerdloff RS. Measurement of total serum testosterone in adult men: comparison of current laboratory methods versus liquid chromatography-tandem mass spectrometry. J Clin Endocrinol Metab. 2004;89(6):534–43. - PubMed
-
- Giese R. Measurement of endogenous estrogens: analytical challenges and recent advances. J Chromatogr A. 2003;1000(1–2):401–12. - PubMed
-
- Stanczyk F, Lee JS, Santen RJ. Standardization of steroid hormone assays: why, how and when? Cancer Epidemiology, Biomarkers & Prevention. 2007;16(9):1713–9. - PubMed
Publication types
MeSH terms
Substances
Grants and funding
LinkOut - more resources
Full Text Sources
Medical
