. 2010 Apr 15;50(3):1004-16.
doi: 10.1016/j.neuroimage.2010.01.041. Epub 2010 Jan 18.

Dementia induces correlated reductions in white matter integrity and cortical thickness: a multivariate neuroimaging study with sparse canonical correlation analysis

Affiliations

Dementia induces correlated reductions in white matter integrity and cortical thickness: a multivariate neuroimaging study with sparse canonical correlation analysis

Brian B Avants et al. Neuroimage. .

Abstract

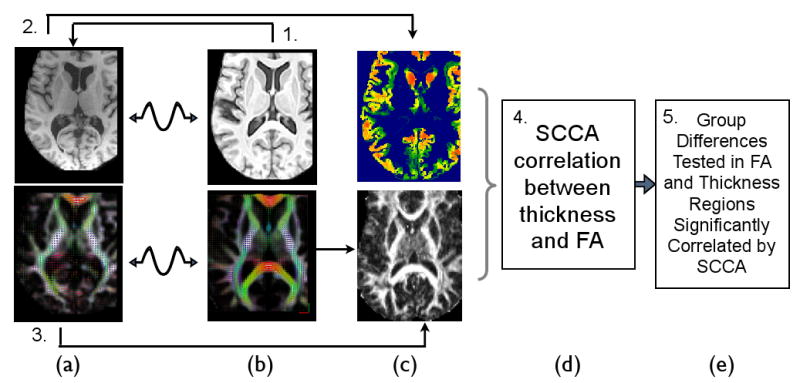
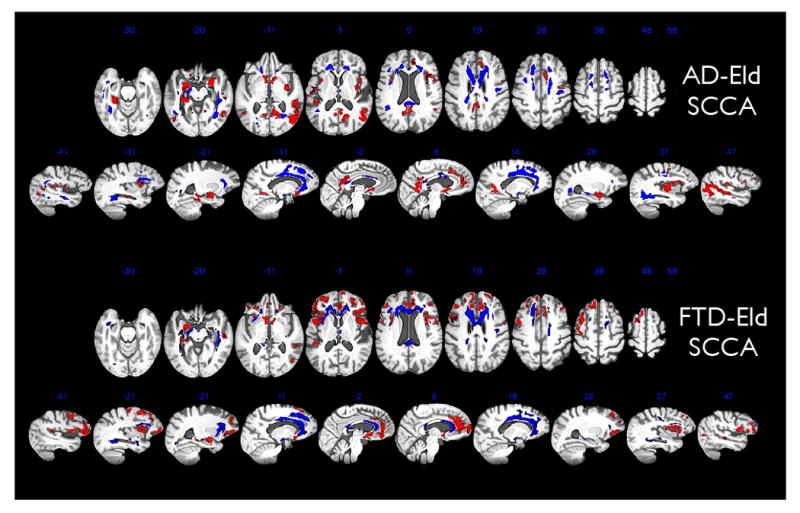
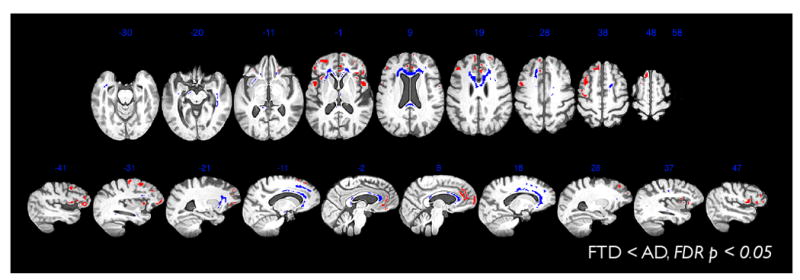
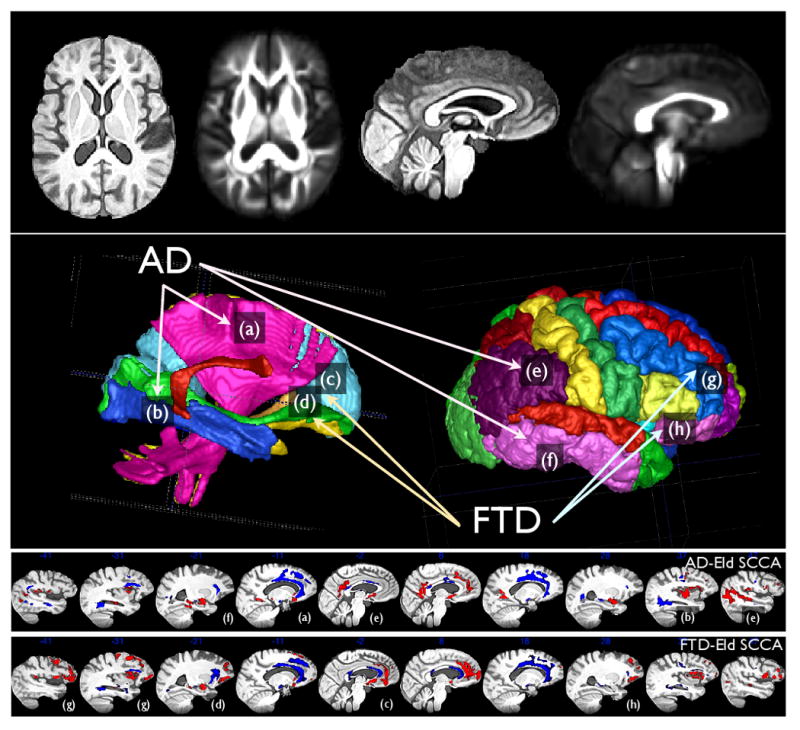
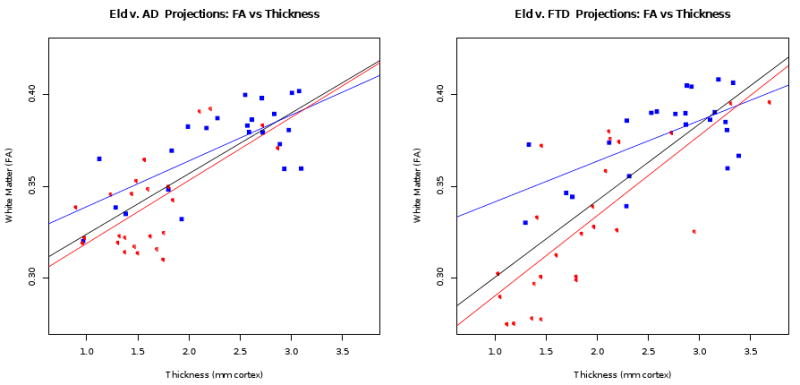
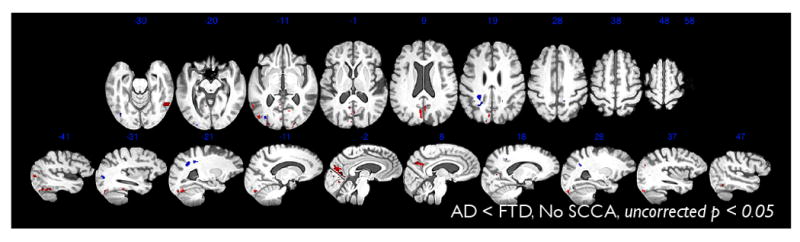
We use a new, unsupervised multivariate imaging and analysis strategy to identify related patterns of reduced white matter integrity, measured with the fractional anisotropy (FA) derived from diffusion tensor imaging (DTI), and decreases in cortical thickness, measured by high resolution T1-weighted imaging, in Alzheimer's disease (AD) and frontotemporal dementia (FTD). This process is based on a novel computational model derived from sparse canonical correlation analysis (SCCA) that allows us to automatically identify mutually predictive, distributed neuroanatomical regions from different imaging modalities. We apply the SCCA model to a dataset that includes 23 control subjects that are demographically matched to 49 subjects with autopsy or CSF-biomarker-diagnosed AD (n=24) and FTD (n=25) with both DTI and T1-weighted structural imaging. SCCA shows that the FTD-related frontal and temporal degeneration pattern is correlated across modalities with permutation corrected p<0.0005. In AD, we find significant association between cortical thinning and reduction in white matter integrity within a distributed parietal and temporal network (p<0.0005). Furthermore, we show that-within SCCA identified regions-significant differences exist between FTD and AD cortical-connective degeneration patterns. We validate these distinct, multimodal imaging patterns by showing unique relationships with cognitive measures in AD and FTD. We conclude that SCCA is a potentially valuable approach in image analysis that can be applied productively to distinguishing between neurodegenerative conditions.


Figures

Figure 1
Figure 1
The multivariate image analysis strategy used in this study analyzes DTI and T1 separately until the last step. The individual's DT and T1 space, in column (a), is mapped to the DT and T1 components of the template, in column (b), by modality-specific registration strategies. The Fractional anisotropy in template space is then derived from the deformed DTI data, bottom column (c). The cortical thickness is separately derived from the individual T1 data by performing prior-based image segmentation and DiReCT (Das et al., 2009) thickness estimation. The derived voxel-wise thickness image is then mapped to the template space. In (d), SCCA is used to analyze positive correlations between thickness and FA, without respect to group labelings. Finally, in (e), downstream statistics may be assessed within the significantly correlated regions identified by SCCA. For instance, group statistical tests may be restricted to those voxels in T1 and DTI that are mutually informative thus reducing the multiple comparisons problem while increasing interpretability in bi-modality studies.
Figure 2
Figure 2
This figure shows FA regions in blue that SCCA-correlate with the cortical atrophy in the red areas for both the AD-Eld and FTD-Eld analysis. Results are aggregated in a population-specific template across 23 elderly subjects, 25 FTD and 24 AD subjects and which integrates modalities into a common reference frame. Thickness and FA values derived from T1 and DTI are then related across elderly, AD and FTD through our multivariate SCCA imaging strategy. In this figure, the DTI component of the analysis has been mapped diffeomorphically to the T1 template in order to show both cortical (red) and white matter effects (blue) within the same space. For both images, brighter red/blue voxels indicate greater importance for the correlation. Most of the variation in brightness is along the edges of the regions. Both axial views and sagittal views of our imaging results are shown. The AD-Eld SCCA analysis shows the SCCA weights derived from grouping the elderly and AD data. The FTD-Eld SCCA analysis shows the SCCA weights derived from grouping the elderly and FTD data. The significance of the SCCA associations for each group was p < 0.005, assessed by permutation.
Figure 3
Figure 3
SCCA is valuable for dimensionality reduction. Thus, we use the regions found in AD-FTD SCCA to test for AD < FTD effects. No results were found where the FDR corrected p-value < 0.05. We also test for FTD < AD effects. Results are shown here which survive FDR corrected p-value < 0.05. FTD < AD effects are present in both white matter and cortex in many of the original areas selected by SCCA. Note that when the same FTD-AD analyses are performed within a mask including all voxels in the brain, the results do not survive FDR correction for either FA or cortical thickness. Thus, the SCCA restricted comparison has, in this study, enhanced detection power.
Figure 4
Figure 4
The DTI template's FA image and the T1 template are shown together after diffeomorphically mapping to the same space in the top row. The middle row shows the labels that aided the annotation in the results tables and to help guide interpretation. The bottom rows reproduce the sagittal slices of the AD and FTD SCCA results. The figure also connects some of the prominent labeled anatomical regions with the SCCA results. Label (a) indicates the corticospinal tract (cst) in both the labeled DTI space (middle left) and in the AD-Eld SCCA results. We also highlight the inferior longitudinal fasiculus (b), anterior corpus callosum (c) and the inferior fronto-occipital fasciculus (d). Cortical labeling points to the inferior parietal lobe/posterior cingulate (e), the inferior temporal lobe (f), the middle frontal gyrus (g) and the orbitofrontal cortex (h). These regions were selected to bring attention to some areas of difference between FTD and AD SCCA results.
Figure 5
Figure 5
FA and thickness projections for elderly and AD groups (left) and elderly and FTD groups (right). Each subject is projected to a point on this graph where we have an aggregate summary of the FA and thickness relationships over the network of voxels selected from each modality by SCCA. In each plot, red open circle points indicate the diseased group and blue closed squares indicate the control group. The black regression line fits all data points while red fits the diseased group and blue the control group. The regression lines are each fitted between the FA projection and the thickness projection, for each group.
Figure 6
Figure 6
This figure shows slices from a whole brain, uncorrected map (p < 0.05) of the regions where AD < FTD in either cortical thickness (red) or FA (blue). This contrast indicates that some regions of the brain show a trend towards being more affected by AD than FTD, although these effects did not survive FDR correction, were not selected by CCA and may not show cross-modality association.

Similar articles

Cited by

References

    1. Arnold SE, Hyman BT, Hoesen GWV. Neuropathologic changes of the temporal pole in Alzheimer's disease and Pick's disease. Arch Neurol. 1994 Feb;51(2):145–150. - PubMed
    1. Avants B, Duda JT, Kim J, Zhang H, Pluta J, Gee JC, Whyte J. Multivariate analysis of structural and diffusion imaging in traumatic brain injury. Acad Radiol. 2008 Nov;15(11):1360–1375. - PMC - PubMed
    1. Avants BB, Duda JT, Zhang H, Gee JC. Multivariate normalization with symmetric diffeomorphisms for multivariate studies. Med Image Comput Comput Assist Interv. 2007;10(Pt 1):359–366. - PubMed
    1. Ballmaier M, O'Brien JT, Burton EJ, Thompson PM, Rex DE, Narr KL, McKeith IG, DeLuca H, Toga AW. Comparing gray matter loss profiles between dementia with lewy bodies and Alzheimer's disease using cortical pattern matching: diagnosis and gender effects. Neuroimage. 2004;23:325–335. - PubMed
    1. Barnes J, Godbolt AK, Frost C, Boyes RG, Jones BF, Scahill RI, Rossor MN, Fox NC. Atrophy rates of the cingulate gyrus and hippocampus in AD and FTLD. Neurobiol Aging. 2007 Jan;28(1):20–28. - PubMed

Publication types

MeSH terms