

Automated 3D mapping of baseline and 12-month associations between three verbal memory measures and hippocampal atrophy in 490 ADNI subjects
- PMID: 20083211
- PMCID: PMC2847034
- DOI: 10.1016/j.neuroimage.2009.12.125
Automated 3D mapping of baseline and 12-month associations between three verbal memory measures and hippocampal atrophy in 490 ADNI subjects
Abstract
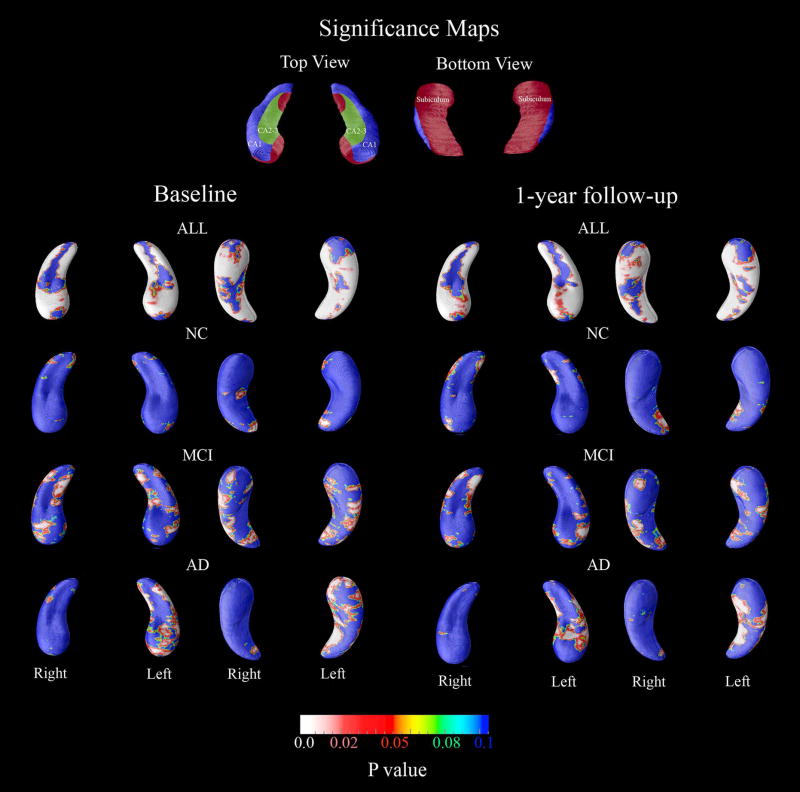
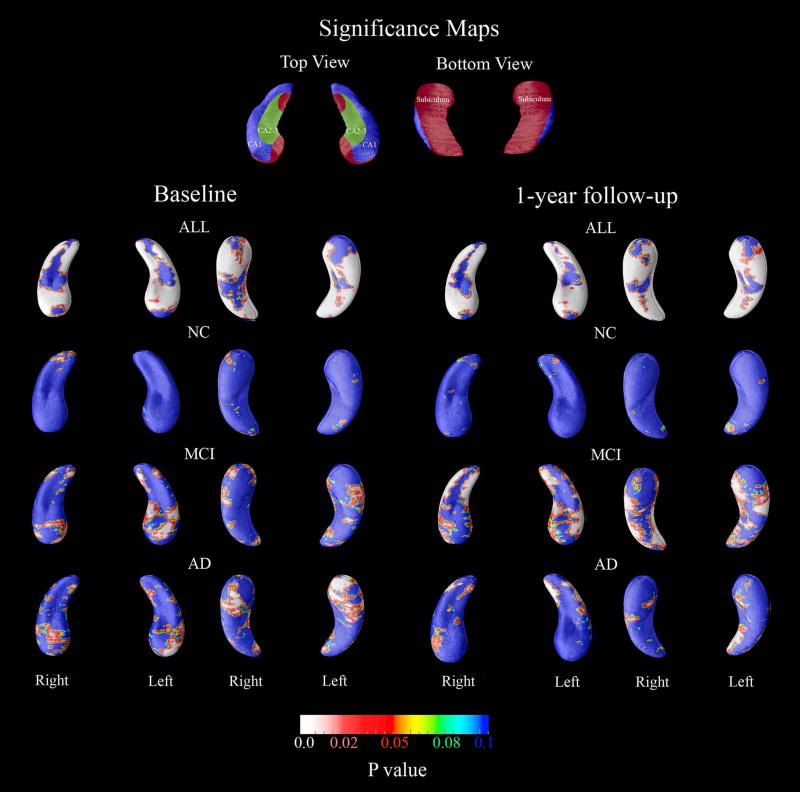
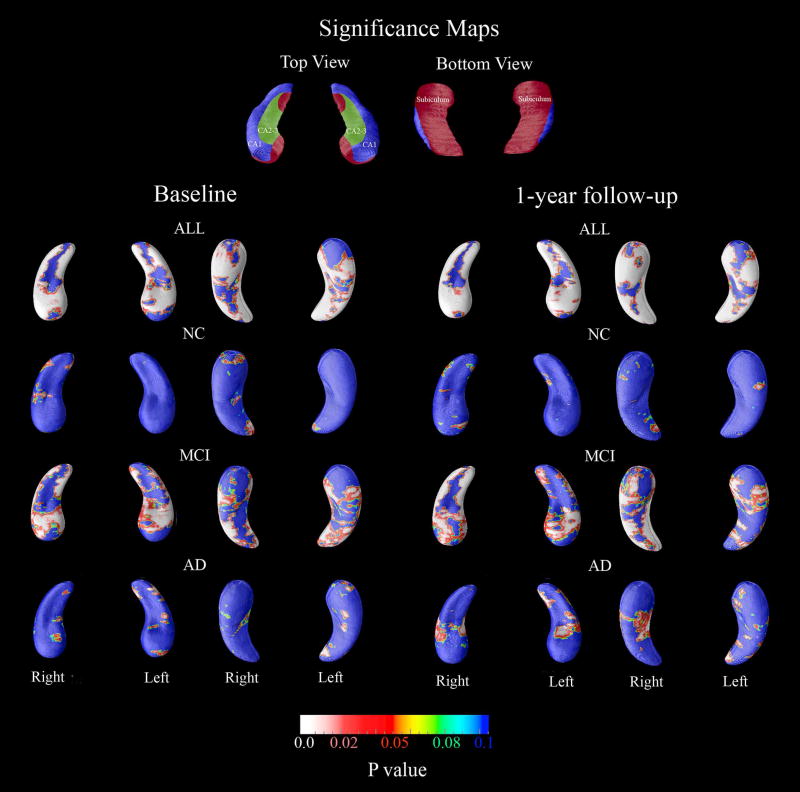
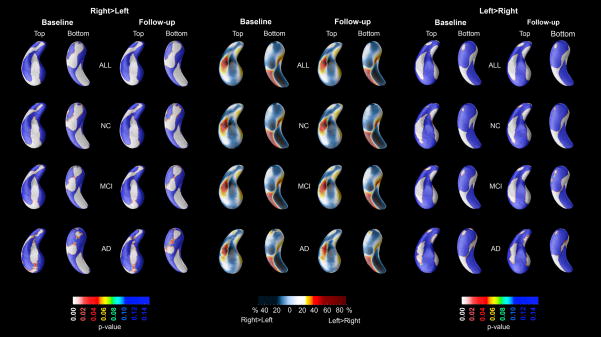
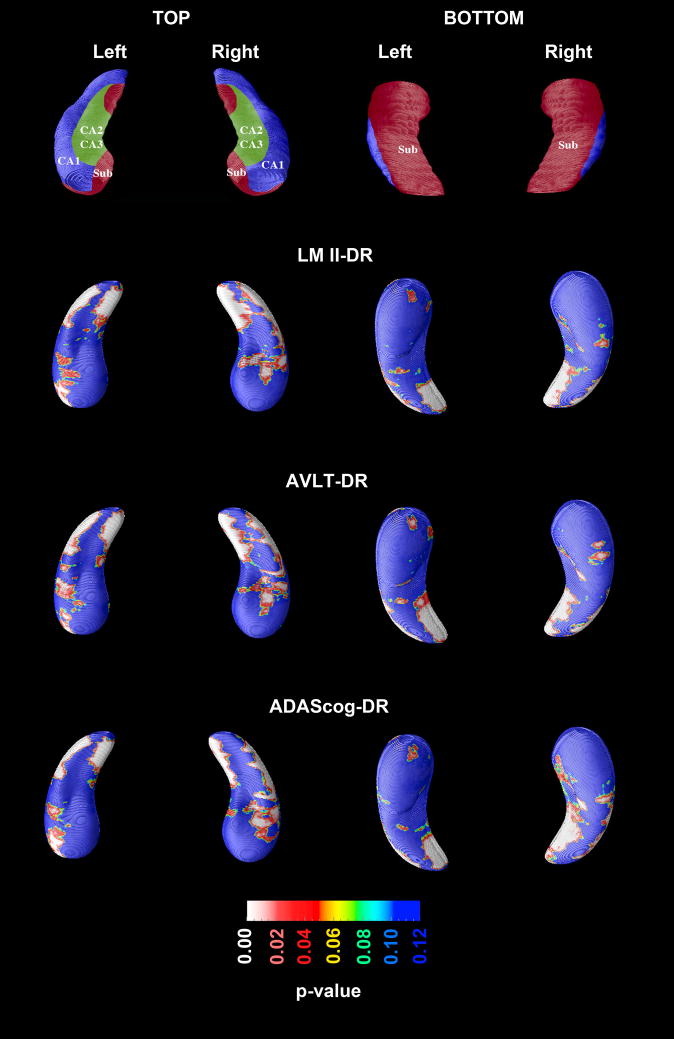
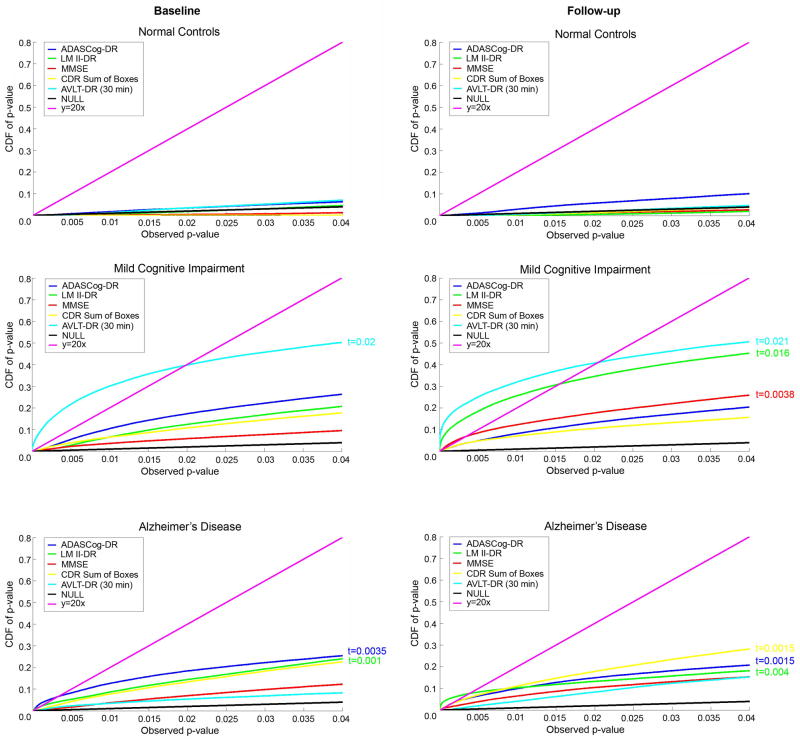
We used a previously validated automated machine learning algorithm based on adaptive boosting to segment the hippocampi in baseline and 12-month follow-up 3D T1-weighted brain MRIs of 150 cognitively normal elderly (NC), 245 mild cognitive impairment (MCI) and 97 Dementia of the Alzheimer's type (DAT) ADNI subjects. Using the radial distance mapping technique, we examined the hippocampal correlates of delayed recall performance on three well-established verbal memory tests--ADAScog delayed recall (ADAScog-DR), the Rey Auditory Verbal Learning Test -DR (AVLT-DR) and Wechsler Logical Memory II-DR (LM II-DR). We observed no significant correlations between delayed recall performance and hippocampal radial distance on any of the three verbal memory measures in NC. All three measures were associated with hippocampal volumes and radial distance in the full sample and in the MCI group at baseline and at follow-up. In DAT we observed stronger left-sided associations between hippocampal radial distance, LM II-DR and ADAScog-DR both at baseline and at follow-up. The strongest linkage between memory performance and hippocampal atrophy in the MCI sample was observed with the most challenging verbal memory test-the AVLT-DR, as opposed to the DAT sample where the least challenging test the ADAScog-DR showed strongest associations with the hippocampal structure. After controlling for baseline hippocampal atrophy, memory performance showed regionally specific associations with hippocampal radial distance in predominantly CA1 but also in subicular distribution.
Copyright (c) 2009 Elsevier Inc. All rights reserved.
Figures
References
-
- Apostolova LG, Dinov ID, Dutton RA, Hayashi KM, Toga AW, Cummings JL, Thompson PM. 3D comparison of hippocampal atrophy in amnestic mild cognitive impairment and Alzheimer’s disease. Brain. 2006a;129:2867–2873. - PubMed
-
- Apostolova LG, Dutton RA, Dinov ID, Hayashi KM, Toga AW, Cummings JL, Thompson PM. Conversion of mild cognitive impairment to Alzheimer disease predicted by hippocampal atrophy maps. Arch Neurol. 2006b;63:693–699. - PubMed
-
- Benjamini Y, Hochberg Y. Controlling the false discovery rate: a pracxtical and powerful approach to multiple testing. J Royal Stat Soc Series B. 1995;57:289–300.
-
- Bobinski M, Wegiel J, Tarnawski M, Bobinski M, Reisberg B, de Leon MJ, Miller DC, Wisniewski HM. Relationships between regional neuronal loss and neurofibrillary changes in the hippocampal formation and duration and severity of Alzheimer disease. Journal of Neuropathology & Experimental Neurology. 1997;56:414–420. - PubMed
Publication types
MeSH terms
Grants and funding
- EB01651/EB/NIBIB NIH HHS/United States
- K23 AG026803/AG/NIA NIH HHS/United States
- P41 RR013642/RR/NCRR NIH HHS/United States
- U54 RR021813/RR/NCRR NIH HHS/United States
- LM05639/LM/NLM NIH HHS/United States
- R21 RR019771/RR/NCRR NIH HHS/United States
- R01 LM005639/LM/NLM NIH HHS/United States
- U01 AG024904/AG/NIA NIH HHS/United States
- U19 AG010483/AG/NIA NIH HHS/United States
- RR019771/RR/NCRR NIH HHS/United States
- P50 AG016570/AG/NIA NIH HHS/United States
- R01 MH071940/MH/NIMH NIH HHS/United States
- P 50 AG16570/AG/NIA NIH HHS/United States
LinkOut - more resources
Full Text Sources
Miscellaneous
