. 2010 Oct;20(10):2333-47.
doi: 10.1093/cercor/bhp310. Epub 2010 Jan 18.

Serotonin 3A receptor subtype as an early and protracted marker of cortical interneuron subpopulations

Affiliations

Serotonin 3A receptor subtype as an early and protracted marker of cortical interneuron subpopulations

Ksenija Vucurovic et al. Cereb Cortex. 2010 Oct.

Abstract

To identify neocortical neurons expressing the type 3 serotonergic receptor, here we used transgenic mice expressing the enhanced green fluorescent protein (GFP) under the control of the 5-HT(3A) promoter (5-HT(3A):GFP mice). By means of whole-cell patch-clamp recordings, biocytin labeling, and single-cell reversed-transcriptase polymerase chain reaction on acute brain slices of 5-HT(3A):GFP mice, we identified 2 populations of 5-HT(3A)-expressing interneurons within the somatosensory cortex. The first population was characterized by the frequent expression of the vasoactive intestinal peptide and a typical bipolar/bitufted morphology, whereas the second population expressed predominantly the neuropeptide Y and exhibited more complex dendritic arborizations. Most interneurons of this second group appeared very similar to neurogliaform cells according to their electrophysiological, molecular, and morphological properties. The combination of 5-bromo-2-deoxyuridine injections with 5-HT(3A) mRNA detection showed that cortical 5-HT(3A) interneurons are generated around embryonic day 14.5. Although at this stage the 5-HT(3A) receptor subunit is expressed in both the caudal ganglionic eminence and the entopeduncular area, homochronic in utero grafts experiments revealed that cortical 5-HT(3A) interneurons are mainly generated in the caudal ganglionic eminence. This protracted expression of the 5-HT(3A) subunit allowed us to study specific cortical interneuron populations from their birth to their final functional phenotype.


Figures
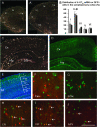
Figure 1.
Figure 1.
Expression of 5-HT3A in the adult telencephalon. (A, A′, C) Coronal sections from an adult wild-type mouse showing the distribution of 5-HT3A transcripts. (B) Graph showing the density of both 5-HT3A mRNA-expressing cells from adult wild-type animals (gray bars) and 5-HT3A:GFP+ cells from transgenic 5-HT3A:GFP mice (black bars) in the different layers of the somatosensory cortex. Data are means ± standard error of the mean (SEM). (C,D) Sections from identical stereotaxic levels showing “a similar location of both 5-HT3A mRNA-expressing cells from a wild type” mouse (C) and GFP fluorescent cells from a 5-HT3A:GFP mouse (D). (E) Coronal section of a 5-HT3A:GFP mouse counterstained with Dapi (blue) showing the preferential location of 5-HT3A-expressing cells in supragranular layers. Cortical layers are indicated. (FJ) Expression of 5-HT3A:GFP (green) is restricted to subpopulations of interneurons (red). (F,G) Overlays showing the lack of Parv (F) or SOM (G) expression in GFP+ cells. (HJ) Overlays showing the colocalization of GFP with CR (H), VIP (I), or NPY (J). A1, agranular insular cortex; BA, basolateral amygdaloid nucleus; Cg, cingulate cortex area; Ctx, cerebral cortex; G, gustatory cortex area; Hip, hippocampus; M, motor cortex area; Pir, piriform cortex; S1, somatosensory cortex area; Scale bar: (AA′) 1 mm; (C,D) 700 μm; (E) 500 μm; and (FJ) 100 μm.
Figure 2.
Figure 2.
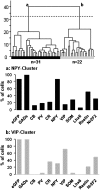
Unsupervised cluster analysis applied to GFP-positive neocortical neurons. The x axis represents individual cells, and the y axis represents the average within-cluster linkage distance. Distances were calculated on the basis of the laminar location of the cells, in addition to 28 electrophysiological parameters (see Supplementary Methods S1). On the basis of the Thorndike threshold (dotted line), this analysis disclosed 2 groups of cells (corresponding to branches a and b): the NPY-cluster (black) and the VIP-cluster (gray). Histograms show the distribution of molecular markers within each cluster.
Figure 3.
Figure 3.
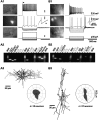
Electrophysiological, molecular and morphological properties of 5-HT3A-expressing interneurons of the NPY-cluster and VIP-cluster. (A1) The electrophysiological behavior of a neuron belonging to the NPY-cluster was recorded using whole-cell patch-clamp recording in current-clamp mode, in response to current pulses injections (lower traces). Suprathreshold and just above the threshold responses are illustrated in the upper and medium traces, respectively. Just above threshold current induced the delayed firing of action potentials. Application of a larger depolarizing current induced a marked frequency adaptation with pronounced amplitude accommodation (upper trace, asterisk). The right inset shows the repolarization phase of the first action potential. Note the monophasic aspect of the after hyperpolarization. The Infrared and epifluorescence images of the same neuron have been taken just before the recording (top and middle panels) and during the recording (bottom panel) (scale bar 10 μm). (A2) Agarose gel showing the expression of GFP, GAD67, GAD65, NPY, Nr2F2, and Reelin. (B1) Voltage traces recorded from a VIP-cluster neuron in response to current pulses (lower traces). The right inset details the complex repolarization phase of the first action potential. On the left panels, the infrared and epifluorescence images of the same cell were taken just before and during the recording (scale bar: 10 μm). (B2) Agarose gel showing the expression of GFP, GAD65, VIP, and Reelin. (A3,B3) Neurolucida reconstructions of the neurons shown in (A1,B1), respectively. Axons are represented in gray, whereas somata and dendrites are illustrated in black. Cells of the NPY-cluster show characteristics of “neurogliaform” neurons: the soma of these cells is rather multipolar with smooth dendrites and the axon is densely distributed within and around the dendritic arborization (A3). VIP-positive cells are characterized by their bipolar, vertically oriented main dendrites and axon (B3). Polar histograms illustrate the results of the Wedge analysis for each cluster of cells. The dendritic arbors organization around the centroid of the cells bodies was quantified by plotting the averaged dendritic length for each equiangular wedge.
Figure 4.
Figure 4.
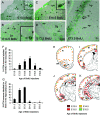
Birth-dating of telencephalic 5-HT3A interneurons. (A–E) Simultaneous detection of 5-HT3A transcripts (black) and BrdU (green) in coronal sections at the level of the cerebral cortex (AC), the cingulated cortex (D) and the hippocampus (E) in P25 wild-type mice. Age of pulse injection is indicated on the images. (AC) Coronal sections taken at the level of the primary somatosensory cortex showing double-labeled cells in the supragranular layers (arrows). (D) Coronal section taken at the level of the cingulate cortex. (F,G) Histograms showing the percentage of 5-HT3A-expressing cells labeled for BrdU after a pulse injection at a given age, quantified in the neocortex (F) and the hippocampus (G). Note that the peak of genesis of cortical 5-HT3A-expressing cells takes place around E14.5. Data are represented as mean ± SEM (percentage of double-labeled cells over the 5-HT3A-postive cells). (H–K) Drawings showing the location and date of genesis of 5-HT3A-expressing cells. Drawings are presented from rostral (H) to caudal (K). A1, auditory cortex; Amg, amygdala; CA1-3, field CA1-3 of the hippocampus; Cl, claustrum; Cg, cingulate cortex area; DG, dentate gyrus; Fr, Frontal cortex area G, gustatory cortex area; M, motor cortex area; Pir, piriform cortex; PO, primary olfactory cortex; RF, Rhinal fissure; RS, retrosplenial cortex; S1, somatosensory cortex area; V1, visual cortex area. Scale bar: (AD) 200 μm; (E) 250 μm.
Figure 5.
Figure 5.
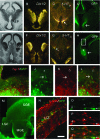
Expression of 5-HT3A in the developing embryo at E14.5. (A,E): Brightfield coronal views of the entopeduncular area (AEP, A) and the caudal ganglionic eminence (CGE, E). (C,D,G,H): Coronal sections where arrows point to restricted expression of 5-HT3A mRNA in wild-type mouse (C,G) and GFP immunostaining from a 5-HT3A:GFP transgenic mouse (D,H). The main sites of 5-HT3A expression where located at the telencephalic–diencephalic junction, in AEP (A,B,D) and in CGE (E,F,H). (B–F) Alternate sections of the preparations shown in (A,E) showing Dlx1/2 expression. (IL) Coronal section taken at the level of the CGE indicated by the asterisk in (H) showing cells double labeled for GFP (green) and the postmitotic marker tuj-1 (red). (JL) Higher magnifications of the region shown in (I). Arrow points to a double-labeled cell and the open arrowhead points to a cell expressing only tuj-1. (M) Whole-mount preparation of a E14.5 5-HT3A:GFP embryo showing restricted expression of GFP+ cells in the CGE. (N) Coronal section of the caudal cortex (boxed in H) of a 5-HT3A:GFP embryo stained for GABA (red) showing GABA+ cells in the migratory pathway of interneurons (LIZ). (OQ) High-power view of the section shown in (N). Note that only a proportion of GABA+ cells express GFP (arrows) and that all GFP+ cells in LIZ express GABA. The asterisk points to a GABA-positive cell that is not expressing GFP. LGE, lateral ganglionic eminence, LIZ, Low intermediate zone, MGE, medial ganglionic eminence. Scale bar: (AC,EG) 1 mm; (D,H) 800 μm; (I,N) 125 μm; (JL) 90 μm; (M) 500 μm; (O–Q) 75 μm.
Figure 6.
Figure 6.
Distribution of 5-HT3A:GFP+ grafted cells derived from the APE/Po and CGE. (A) Schematic drawings indicating the regions taken for donor cells dissociation. (B) Schematic drawings showing the general distribution of 5-HT3A:GFP+ grafted cells in the host brain (P19–P25). Amg, amygdala; BLA, basolateral amygdaloid nucleus; Cg, cingulate cortex area; DEn, dorsal endopiriform nucleus; DG, dentate gyrus; LA, lateral amygdaloid nucleus; M, motor cortex; Pir, piriform cortex; PlCo, posterolateral cortical amygdaloid nucleus; PMCo, posteromedial cortical amygdaloid nucleus; S1, somatosensory cortex.
Figure 7.
Figure 7.
Fate of In utero grafted 5-HT3A:GFP+ cells from the CGE at E14.5. (A) Schematic drawing illustrating the in utero grafting technique. (B) Histogram (percentage ± SEM) indicating the laminar distribution of 5-HT3A:GFP+ grafted cells (n = 235 cells obtained from 7 grafted animals) in the somatosensory cortex. Cortical strips (500 μm width) were longitudinally subdivided into 10 equal bins from the marginal zone (MZ) to the lower part of the layer VI (LLVI). (C,D) E14 5-HT3A:GFP+ CGE-derived cells give rise to numerous interneurons located in the supragranular layers of the cerebral cortex. Note that the section shown in panel (C) was taken from an animal that received 5-HT3A:GFP+ cells that were sorted by flow cytometry. (E) Section showing 5-HT3A:GFP+ cells located in the supragranular layers of the cortex and displaying bipolar or double bouquet morphologies. Cortical layers are indicated. (F) Section showing multipolar 5-HT3A:GFP+ grafted cells located in cortical layer I displaying complex morphologies. (GO) Neocortical grafted cells labeled for CR (GI; red), VIP (JL; red) or NPY (MO; red) in the supragranular layers II–III. (P) Histogram showing the percentage of grafted cells that express different interneuronal markers in the somatosensory cortex. Throughout the cortex, the most commonly expressed markers were CR, VIP and NPY. Scale bar: (CD): 700 μm; (E): 80 μm; (FO) 100 μm.

Similar articles

Cited by

References

    1. Alcántara S, Ruiz M, D'Arcangelo G, Ezan F, de Lecea L, Curran T, Sotelo C, Soriano E. Regional and cellular patterns of reelin mRNA expression in the forebrain of the developing and adult mouse. J Neurosci. 1998;18:7779–7799. - PMC - PubMed
    1. Anderson S, Mione M, Yun K, Rubenstein JL. Differential origins of neocortical projection and local circuit neurons: roles of Dlx genes in neocortical interneurogenesis. Cereb Cortex. 1999;9:646–654. - PubMed
    1. Anderson SA, Marín O, Horn C, Jennings K, Rubenstein JL. Distinct cortical migrations from the medial and lateral ganglionic eminences. Development. 2001;128:353–363. - PubMed
    1. Andjelic S, Gallopin T, Cauli B, Hill EL, Roux L, Badr S, Hu E, Tamas G, Lambolez B. Glutamatergic non-pyramidal neurons from neocortical layer VI and their comparison with pyramidal and spiny stellate neurons. J Neurophysiol. 2008;101:641–654. - PMC - PubMed
    1. Ang ES, Jr., Haydar TF, Glucnic V, Rakic P. Four-dimensional migratory coordinates of GABAergic interneurons in the developing mouse cortex. J Neurosci. 2003;23:5805–5815. - PMC - PubMed

Publication types

MeSH terms