. 2010 Mar 26;285(13):10098-10109.
doi: 10.1074/jbc.M109.043711. Epub 2010 Jan 18.

CB1 cannabinoid receptors increase neuronal precursor proliferation through AKT/glycogen synthase kinase-3beta/beta-catenin signaling

Affiliations

CB1 cannabinoid receptors increase neuronal precursor proliferation through AKT/glycogen synthase kinase-3beta/beta-catenin signaling

Stefania Trazzi et al. J Biol Chem. .

Erratum in

Abstract

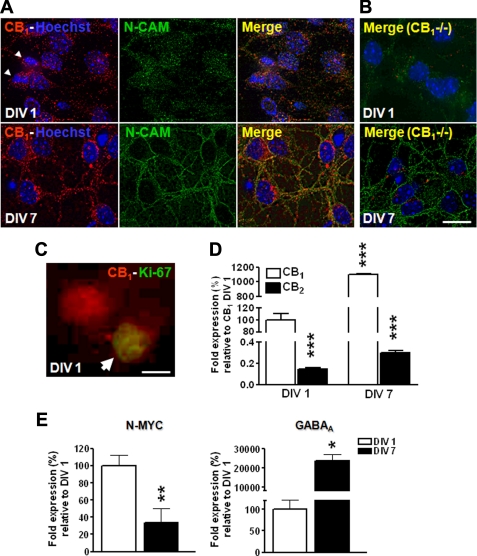
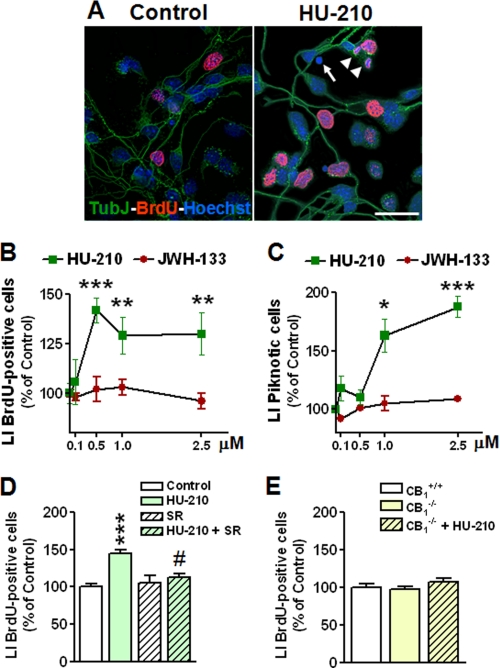
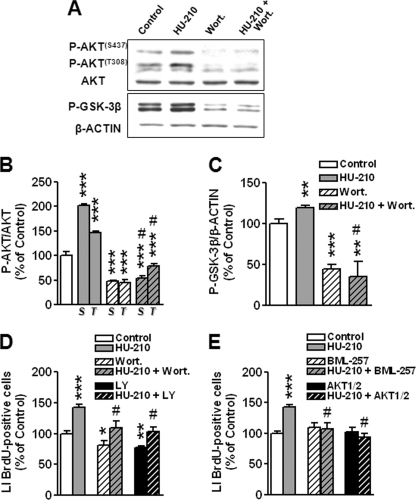
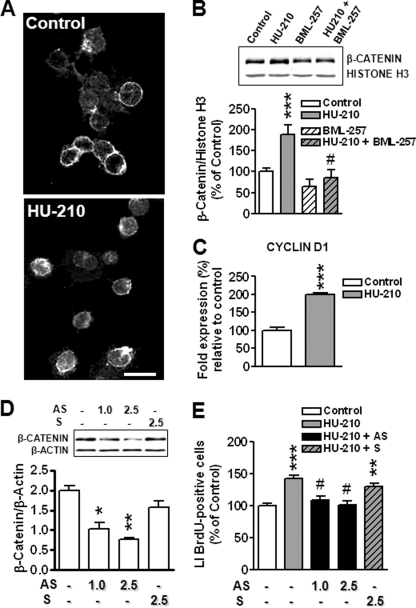
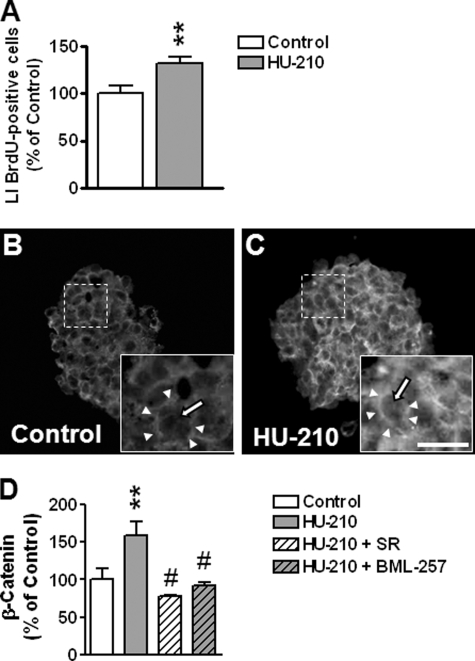
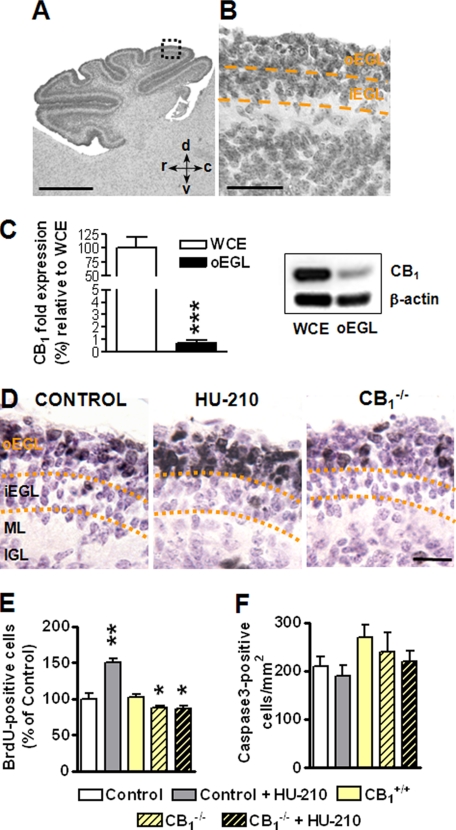
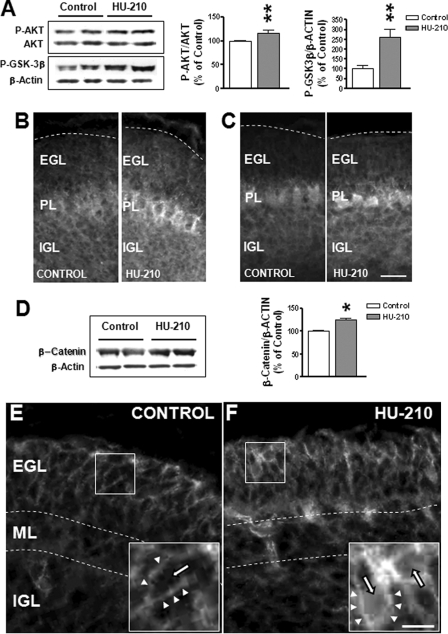
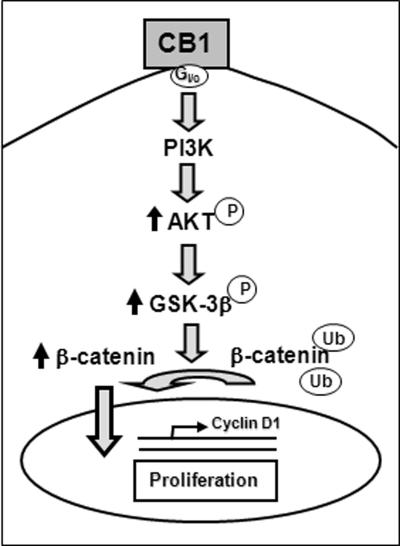
The endocannabinoid system is involved in the regulation of many physiological effects in the central and peripheral nervous system. Recent findings have demonstrated the presence of a functional endocannabinoid system within neuronal progenitors located in the hippocampus and ventricular/subventricular zone that participates in the regulation of cell proliferation. It is presently unknown whether the endocannabinoid system exerts a widespread effect on neuronal precursors from different neurogenic regions, and very little is known about the signaling by which it regulates neuronal precursor proliferation. Herein, we demonstrate the presence of cannabinoid CB(1) receptors in granule cell precursors (GCPs) during early cerebellar development. Activation of CB(1) receptors by HU-210 promoted GCP proliferation in vitro, an effect that was prevented by a selective CB(1) antagonist. Accordingly, in vivo experiments showed that GCP proliferation was increased by chronic HU-210 treatment and that in CB(1)-deficient mice cell proliferation was significantly lower than in wild-type littermates, indicating that the endocannabinoid system is physiologically involved in regulation of GCP proliferation. The pro-proliferative effect of cannabinoids in GCPs was mediated through the CB(1)/AKT/glycogen synthase kinase-3beta/beta-catenin pathway. Involvement of this pathway was also observed in cultures of neuronal precursors from the subventricular zone, suggesting that this pathway may be a general mechanism by which endocannabinoids regulate proliferation of neuronal precursors. These observations suggest that endocannabinoids constitute a new family of lipid signaling cues that may exert a widespread effect on neuronal precursor proliferation during brain development.


Figures

FIGURE 1.
FIGURE 1.
Expression of CB1 and CB2 receptors in GCPs. A and B, double immunofluorescence staining for CB1 (red) and N-CAM (green) of cerebellar granule cells derived from C57BL/6J (A) and CB1−/− (B) P7 mice cultured for 1 day (DIV 1) or 7 days (DIV 7) in vitro. Hoechst staining of nuclei was used to reveal the total number of cells in culture (blue). The arrows indicate condensed mitotic chromosomes of a cell immunostained for CB1 receptors. Scale bar in B: 10 μm applies to A and B. C, double immunofluorescence staining for CB1 (red) and Ki-67 (green) of cerebellar granule cells derived from P7 mice and cultured for 1 day (DIV 1) in vitro. Scale bar: 5 μm. D, CB1 and CB2 mRNA expression, quantified by RT-qPCR, in culture of cerebellar granule cells at DIV 1 and DIV 7. E, N-Myc and GABAA receptor expression, quantified by RT-qPCR, in cultures of cerebellar granule cells at DIV 1 and DIV 7. Data in C and D are expressed as mean ± S.E. of three independent experiments. *, p < 0.05; **, p < 0.01; ***, p < 0.001 (Bonferroni's test after ANOVA).
FIGURE 2.
FIGURE 2.
Effect of HU-210 on proliferation/survival of cultured GCPs. A, 1 h after plating cultures of GCPs were stimulated with HU-210 (0.5 μm) for 20 h. BrdUrd (10 μm) was added for the last 6 h and thereafter cells were processed for double immunofluorescence with anti-BrdUrd (red) and anti-β-tubulin III (TubJ, green) antibodies. Cell nuclei were stained by Hoechst dye (blue). The arrow indicates a pyknotic nucleus; the arrowheads indicate condensed mitotic chromosomes of a BrdUrd-positive cell. Scale bar: 30 μm. B, labeling index (LI), defined as percentage of BrdUrd-positive cells over the total cell number, was determined for GCP (DIV 1) treated with different doses of HU-210 (0.1, 0.5, 1, and 2.5 μm) or JWH-133 (0.1, 0.5, 1, and 2.5 μm). C, percentage of apoptotic GCPs over the total cell number in cultures treated as reported in B. Apoptotic cells were evaluated by counting pyknotic Hoechst-stained nuclei. Data (B and C) are expressed as the mean ± S.E. of four independent experiments. The asterisks indicate a significant difference between the treated versus untreated condition; *, p < 0.05; **, p < 0.01; ***, p < 0.001 (Bonferroni test after ANOVA). D, LI was determined in cultures untreated (control) or treated with HU-210 (0.5 μm), SR141716A (2.0 μm, SR), and HU-210 plus SR141716A. Bars are the mean ± S.E. of four independent experiments. ***, p < 0.001, treated versus control (untreated) condition; #, p < 0.01 HU-210 plus SR versus HU-210-only-treated cells (Bonferroni test after ANOVA). E, LI of BrdUrd-positive cells in cultures generated from CB1-deficient mice (CB1−/−) and CB1+/+-treated or untreated with HU-210 (0.5 μm). Bars are the mean ± S.E. of three independent experiments.
FIGURE 3.
FIGURE 3.
Effects of HU-210 on PI3K/AKT/GSK-3β signaling of cultured GCPs. A, examples of immunoblotting with anti-AKT, anti-phospho-AKT-Thr308, anti-phospho-AKT-Ser473, anti-phospho-GSK-3β-Ser9 and anti-β-actin antibodies obtained from total GCP extracts. Cultures of GCP at DIV 1 were stimulated for 1.5 h with HU-210 (0.5 μm), wortmannin (Wort, 100 nm), HU-210 plus wortmannin. B and C, P-AKT-Ser473 (S), P-AKT-Thr308 (T) (B) and P-GSK-3β (C) protein levels were normalized, respectively, to total AKT and β-actin content and expressed as percentage of untreated condition (100%). D, LI was determined for GCPs treated as reported in A or treated with either a selective PI3K inhibitor, LY294002 (LY; 10 μm) or HU-210 plus LY294002. E, LI was determined for GCPs treated with HU-210 (0.5 μm), BML-257 (12.5 μm), HU-210 plus BML-257, Akti-1/2 (60 nm), or HU-210 plus Akti-1/2 for 1.5 h. Bars are the mean ± S.E. of four experiments. *, p < 0.05; **, p < 0.01; ***, p < 0.001 as compared with control (untreated) condition; #, p < 0.05 as compared with corresponding HU-210-treated samples (Bonferroni test after ANOVA).
FIGURE 4.
FIGURE 4.
HU-210 induces nuclear translocation of β-catenin in cultured GCPs. A, images of cultured GCPs either untreated or treated with HU-210 for 1.5 h. β-Catenin localization was detected by immunofluorescence with an anti-β-catenin antibody. Scale bar: 10 μm. B, representative examples of Western blots probed with an anti-β-catenin monoclonal antibody. Nuclear fractions of protein lysates were isolated from GCPs untreated or treated with HU-210 (0.5 μm), BML-257 (12.5 μm), or HU-210 plus BML-257. Analysis of β-catenin levels in nuclear fractions was performed by immunoblotting. Values represent the percentage increase with respect to unstimulated cells (100% control value) and were obtained by normalization of densitometric values of β-catenin with respect to histone H3. Bars are the mean ± S.E. of three experiments. ***, p < 0.001 as compared with control (untreated) condition; #, p < 0.05 as compared with corresponding HU-210-treated samples (Bonferroni test after ANOVA). C, cyclin D1 expression quantified by RT-qPCR, in cultures of GCPs at DIV 1 treated with HU-210 (1.0 μm) for 24 h. Data are expressed as mean ± S.E. of three experiments. ***, p < 0.001 (Bonferroni test after ANOVA). D, Western blots analysis of β-catenin levels in total protein extracts of GCPs treated for 24 h with antisense β-catenin oligonucleotides (AS, 1 μm, 2.5 μm). Sense β-catenin oligonucleotides (S, 2.5 μm) were used as control. Values represent β-catenin levels normalized with respect to β-actin. Bars are the mean ± S.E. of three experiments. *, p < 0.05; **, p < 0.01; ***, p < 0.001 as compared with untreated condition (Bonferroni test after ANOVA). E, LI was determined for GCPs untreated (control) and treated for 24 h with either HU-210 (0.5 μm) or HU-210 plus different concentrations of AS or S oligonucleotides. Bars are the mean ± S.E. of four experiments. **, p < 0.01; ***, p < 0.001 as compared with control (untreated) condition; #, p < 0.05 as compared with HU-210-treated sample (Bonferroni test after ANOVA).
FIGURE 5.
FIGURE 5.
Nuclear β-catenin accumulation through HU-210-mediated AKT activation in neurosphere cultures. A, LI was determined for cultures of neurospheres (at passages 3–4) untreated or treated with HU-210 (0.5 μm). Values represent the percentage increase with respect to untreated cells (100% control value). B and C, images of neurospheres untreated (B) or treated (C) with HU-210 for 1.5 h. β-Catenin sub-cellular localization was detected by immunofluorescence with an anti-β-catenin antibody. The regions enclosed by a square are shown at a higher magnification at the bottom. Note the nuclear localization (nucleus is indicated by the thin arrow) of β-catenin in neurospheres treated with HU-210. Arrowheads indicate the perinuclear β-catenin localization. Scale bar: 40 μm (medium magnifications); 15 μm (high magnifications). D, nuclear β-catenin levels were quantified by immunofluorescence intensity (as described under “Experimental Procedures”) of neurosphere cultures untreated or treated with HU-210 (0.5 μm), HU-210 plus SR141716A (2.0 μm, SR), or HU-210 plus BML-257 (12.5 μm). Values represent the percentage increase with respect to unstimulated cells (100% control value). Bars (A and D) are the mean ± S.E. of three experiments. **, p < 0.01 as compared with control (unstimulated) condition; #, p < 0.05 as compared with corresponding HU-210-treated samples (Bonferroni test after ANOVA).
FIGURE 6.
FIGURE 6.
Effects of HU210 treatment on GCP proliferation during postnatal cerebellar development. A, example of a sagittal Nissl-stained section across the cerebellum of a P6 mouse. Scale bar: 200 μm. B, high magnification photomicrograph of the region enclosed by a square in A showing the cerebellar layers. The dashed lines indicate the borders of the oEGL and iEGL. Scale bar: 50 μm. C, quantification by RT-qPCR of CB1 receptor expression in extracts from the whole cerebellum (WCE) and from the oEGL microdissected with the laser capture technique (see “Experimental Procedures”) of P6 mouse pups. An example of amplicons resolved on acrylamide is shown on the right. Data, given as % of CB1 expression in whole cerebellar extracts, are expressed as the mean ± S.E. ***, p < 0.001 (two-tailed t test). D–F, C57BL/6J, CB1+/+, and CB1−/− mice received two subcutaneous injections either of phosphate-buffered saline (control) or HU-210 (100 μg/kg) for 3 days, starting at P4. Mice received one BrdUrd injections on P6 and were sacrificed after 2 h. Examples of sections immunostained for BrdUrd and counterstained with hematoxylin and eosin (D). Cells with brown nuclei are BrdUrd-positive cells. The dashed lines indicate the borders of the oEGL and iEGL. Scale bar: 25 μm. Quantification of BrdUrd-positive cells in the cerebellum of untreated (n = 5) or HU-210-treated (n = 5) C57BL/6J mice, untreated (n = 4) or HU-210-treated (n = 3) CB1+/+ mice, and untreated (n = 3) or HU-210-treated (n = 3) CB1−/− mice (E). BrdUrd-positive cells were counted in the EGL and were expressed as percentage of BrdUrd positive cells/mm2 relative to control mice. Density of cleaved caspase-3-positive cells (F) in the cerebellum of the mice reported in E. *, p < 0.05; **, p < 0.01; ***, p < 0.001 (Bonferroni test after ANOVA). c, caudal; d, dorsal; iEGL, inner external granular layer; IGL, internal granular layer; ML, molecular layer; oEGL, outer external granular layer; r, rostral; and v, ventral.
FIGURE 7.
FIGURE 7.
Effect of HU-210 on AKT and GSK-3β phosphorylation and β-catenin nuclear translocation during postnatal cerebellar development. A, examples of immunoblotting with anti-phospho-AKT-Ser473 and anti-phospho-GSK-3β-Ser9 antibodies obtained from total cerebellar extracts of P6 untreated and HU-210-treated mice. Protein levels were normalized to total AKT or β-actin content, respectively, and expressed as percentage of untreated condition. Bars are the mean ± S.E. of three experiments. *, p < 0.05; **, p < 0.01, treated versus untreated condition (Bonferroni test after ANOVA). B and C, photomicrographs of sagittal sections immunostained for phospho-AKT-Ser473 (B) and phospho-GSK-3β-Ser9 (C) across the cerebellum of a P6 control and HU-210-treated mouse. Dashed lines indicate the outer borders of the external granular layer. Scale bar: 20 μm. D, representative example of a Western blot (same cerebellar extracts as in A) probed with an anti-β-catenin antibody. Protein levels were normalized to total β-actin content and expressed as percentage of untreated condition. Bars are the mean ± S.E. of three experiments. *, p < 0.05 treated versus untreated condition (Bonferroni test after ANOVA). E and F, photomicrographs of sagittal sections immunostained for β-catenin across the cerebellum of a P6 untreated (E) and HU-210-treated mouse (F). The regions enclosed by a square are shown at a higher magnification at the bottom. Note that in the EGL of untreated animals (E), β-catenin had mainly an extranuclear location (arrowheads), whereas in HU-210-treated animals (F) it was present both at the nuclear (white arrow) and extranuclear level (arrowheads). Dashed lines indicate the borders of the cerebellar layers. The scale bar: 40 μm (medium magnifications); 20 μm (high magnifications) applies to E and F. EGL, external granular layer; IGL, internal granular layer; ML, molecular layer; and PL, Purkinje cell layer.
FIGURE 8.
FIGURE 8.
Schematic drawing summarizing the signaling pathway downstream from CB1 receptors in cerebellar granule cell precursors. Cannabinoids induce neuronal proliferation by CB1 signaling via PI3K/AKT activation, GSK-3β inactivation, and β-catenin nuclear translocation.

Similar articles

Cited by

References

    1. Matsuda L. A., Lolait S. J., Brownstein M. J., Young A. C., Bonner T. I. (1990) Nature 346, 561–564 - PubMed
    1. Munro S., Thomas K. L., Abu-Shaar M. (1993) Nature 365, 61–65 - PubMed
    1. Piomelli D., Giuffrida A., Calignano A., Rodríguez de Fonseca F. (2000) Trends Pharmacol. Sci. 21, 218–224 - PubMed
    1. Porter A. C., Felder C. C. (2001) Pharmacol. Ther. 90, 45–60 - PubMed
    1. Di Marzo V., Melck D., Bisogno T., De Petrocellis L. (1998) Trends Neurosci. 21, 521–528 - PubMed

LinkOut - more resources