

A fluorescence resonance energy transfer-based M2 muscarinic receptor sensor reveals rapid kinetics of allosteric modulation
- PMID: 20083608
- PMCID: PMC2838301
- DOI: 10.1074/jbc.M109.098517
A fluorescence resonance energy transfer-based M2 muscarinic receptor sensor reveals rapid kinetics of allosteric modulation
Abstract
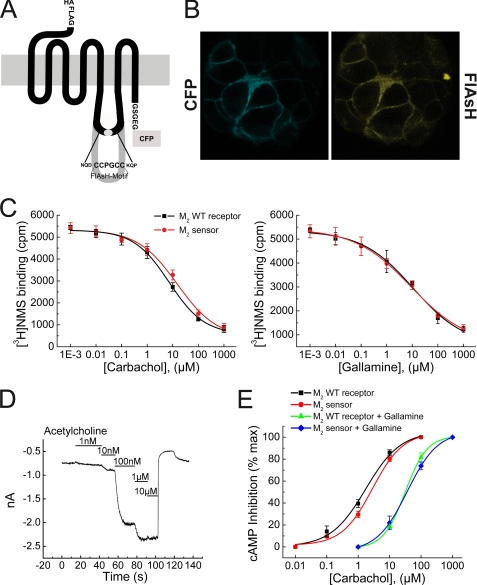
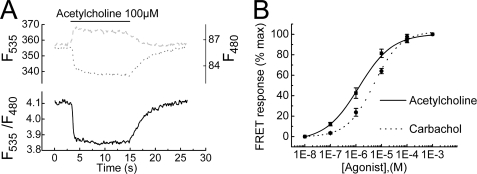
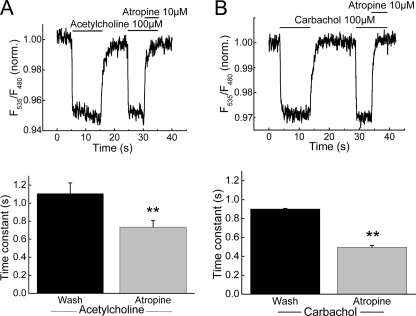
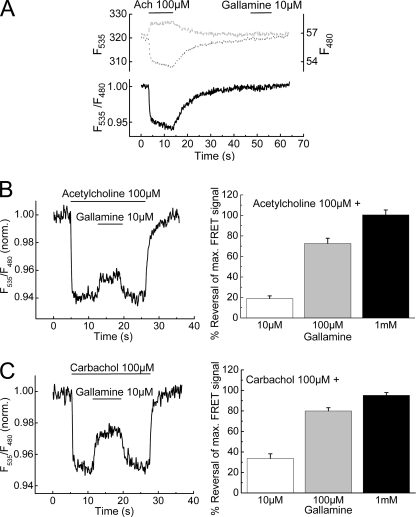
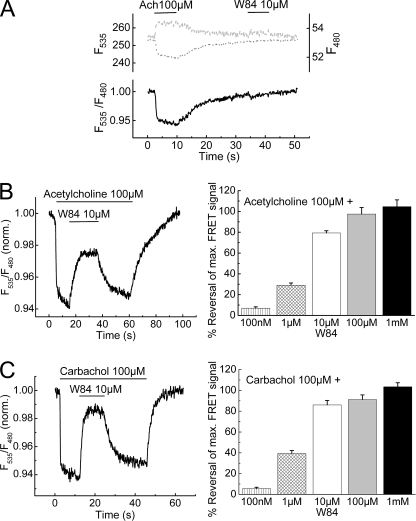
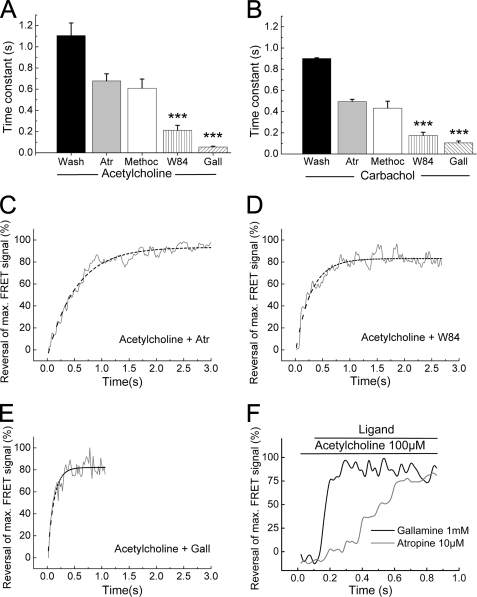
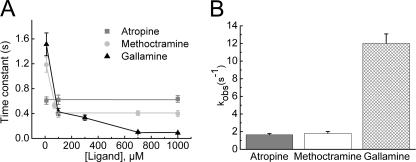
Allosteric modulators have been identified for several G protein-coupled receptors, most notably muscarinic receptors. To study their mechanism of action, we made use of a recently developed technique to generate fluorescence resonance energy transfer (FRET)-based sensors to monitor G protein-coupled receptor activation. Cyan fluorescent protein was fused to the C terminus of the M(2) muscarinic receptor, and a specific binding sequence for the small fluorescent compound fluorescein arsenical hairpin binder, FlAsH, was inserted into the third intracellular loop; the latter site was labeled in intact cells by incubation with FlAsH. We then measured FRET between the donor cyan fluorescent protein and the acceptor FlAsH in intact cells and monitored its changes in real time. Agonists such as acetylcholine and carbachol induced rapid changes in FRET, indicative of agonist-induced conformational changes. Removal of the agonists or addition of an antagonist caused a reversal of this signal with rate constants between 400 and 1100 ms. The allosteric ligands gallamine and dimethyl-W84 caused no changes in FRET when given alone, but increased FRET when given in the presence of an agonist, compatible with an inactivation of the receptors. The kinetics of these effects were very rapid, with rate constants of 80-100 ms and approximately 200 ms for saturating concentrations of gallamine and dimethyl-W84, respectively. Because these speeds are significantly faster than the responses to antagonists, these data indicate that gallamine and dimethyl-W84 are allosteric ligands and actively induce a conformation of the M(2) receptor with a reduced affinity for its agonists.
Figures
Similar articles
-
FRET-based sensors for the human M1-, M3-, and M5-acetylcholine receptors.Bioorg Med Chem. 2011 Feb 1;19(3):1048-54. doi: 10.1016/j.bmc.2010.07.060. Epub 2010 Jul 30. Bioorg Med Chem. 2011. PMID: 20716489
-
Critical amino acid residues of the common allosteric site on the M2 muscarinic acetylcholine receptor: more similarities than differences between the structurally divergent agents gallamine and bis(ammonio)alkane-type hexamethylene-bis-[dimethyl-(3-phthalimidopropyl)ammonium]dibromide.Mol Pharmacol. 2005 Sep;68(3):769-78. doi: 10.1124/mol.105.014043. Epub 2005 Jun 3. Mol Pharmacol. 2005. PMID: 15937215
-
Oligomeric size of the m2 muscarinic receptor in live cells as determined by quantitative fluorescence resonance energy transfer.J Biol Chem. 2010 May 28;285(22):16723-38. doi: 10.1074/jbc.M109.069443. Epub 2010 Mar 19. J Biol Chem. 2010. PMID: 20304928 Free PMC article.
-
G-protein coupled receptors as allosteric machines.Recept Channels. 2004;10(2):51-60. doi: 10.1080/10606820490464316. Recept Channels. 2004. PMID: 15204035 Review.
-
Allosteric interactions at muscarinic cholinoceptors.Clin Exp Pharmacol Physiol. 1998 Mar-Apr;25(3-4):185-94. doi: 10.1111/j.1440-1681.1998.t01-4-.x. Clin Exp Pharmacol Physiol. 1998. PMID: 9590567 Review.
Cited by
-
Novel Xanomeline-Containing Bitopic Ligands of Muscarinic Acetylcholine Receptors: Design, Synthesis and FRET Investigation.Molecules. 2023 Mar 6;28(5):2407. doi: 10.3390/molecules28052407. Molecules. 2023. PMID: 36903650 Free PMC article.
-
Intramolecular fluorescence resonance energy transfer (FRET) sensors of the orexin OX1 and OX2 receptors identify slow kinetics of agonist activation.J Biol Chem. 2012 Apr 27;287(18):14937-49. doi: 10.1074/jbc.M111.334300. Epub 2012 Mar 2. J Biol Chem. 2012. PMID: 22389503 Free PMC article.
-
Reporting from the field: genetically encoded fluorescent reporters uncover signaling dynamics in living biological systems.Annu Rev Biochem. 2011;80:375-401. doi: 10.1146/annurev-biochem-060409-093259. Annu Rev Biochem. 2011. PMID: 21495849 Free PMC article. Review.
-
Distinct Conformational Dynamics of Three G Protein-Coupled Receptors Measured Using FlAsH-BRET Biosensors.Front Endocrinol (Lausanne). 2017 Apr 7;8:61. doi: 10.3389/fendo.2017.00061. eCollection 2017. Front Endocrinol (Lausanne). 2017. PMID: 28439254 Free PMC article.
-
Fluorescent labeling of tetracysteine-tagged proteins in intact cells.Nat Protoc. 2010 Sep;5(10):1666-77. doi: 10.1038/nprot.2010.129. Epub 2010 Sep 23. Nat Protoc. 2010. PMID: 20885379 Free PMC article.
References
-
- May L. T., Avlani V. A., Langmead C. J., Herdon H. J., Wood M. D., Sexton P. M., Christopoulos A. (2007) Mol. Pharmacol. 72, 463–476 - PubMed
-
- Grossmüller M., Antony J., Tränkle C., Holzgrabe U., Mohr K. (2006) Naunyn Schmiedebergs Arch. Pharmacol. 372, 267–276 - PubMed
-
- Huang X. P., Prilla S., Mohr K., Ellis J. (2005) Mol. Pharmacol. 68, 769–778 - PubMed
-
- Holzgrabe U., Bender W., Cid H. M., Staudt M., Pick R., Pfletschinger C., Balatková E., Tränkle C., Mohr K. (2000) Pharm. Acta Helv. 74, 149–155 - PubMed
-
- Tränkle C., Dittmann A., Schulz U., Weyand O., Buller S., Jöhren K., Heller E., Birdsall N. J., Holzgrabe U., Ellis J., Höltje H. D., Mohr K. (2005) Mol. Pharmacol. 68, 1597–1610 - PubMed
Publication types
MeSH terms
Substances
LinkOut - more resources
Full Text Sources
Other Literature Sources
