. 2010 Apr;184(4):1077-94.
doi: 10.1534/genetics.109.111963. Epub 2010 Jan 18.

Duplication frequency in a population of Salmonella enterica rapidly approaches steady state with or without recombination

Affiliations

Duplication frequency in a population of Salmonella enterica rapidly approaches steady state with or without recombination

Andrew B Reams et al. Genetics. 2010 Apr.

Abstract

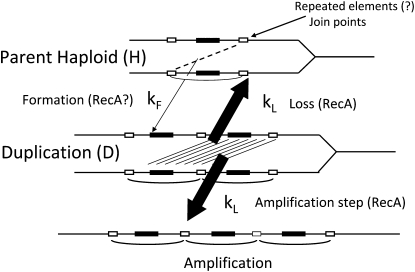
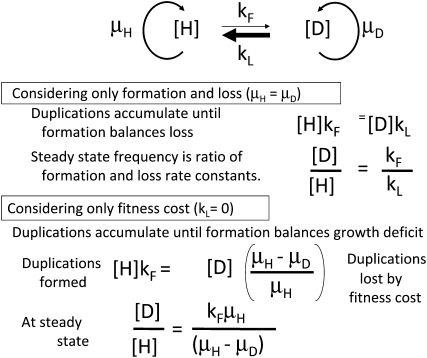
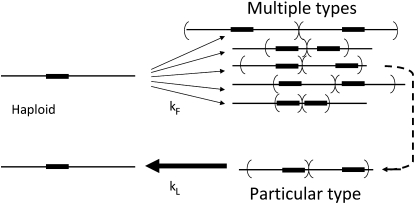
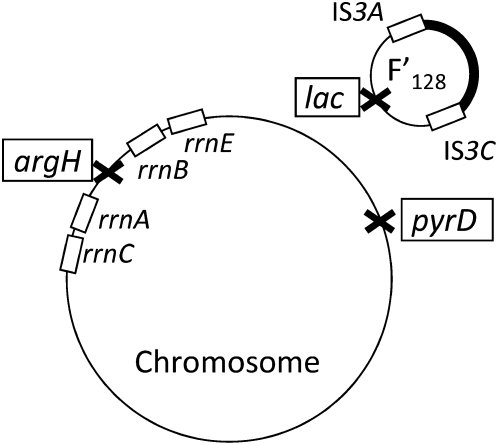
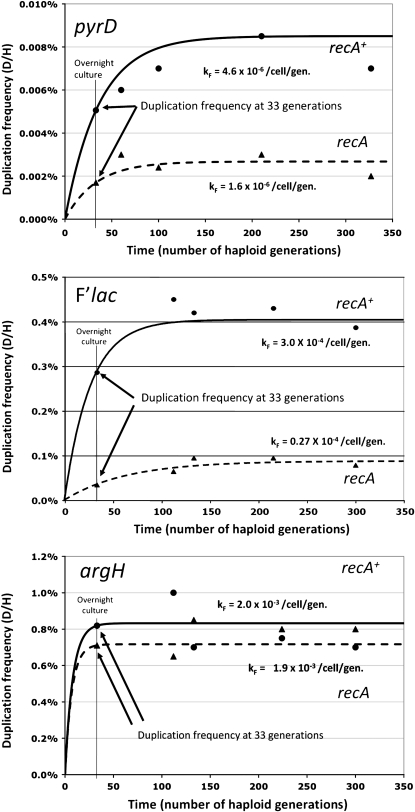
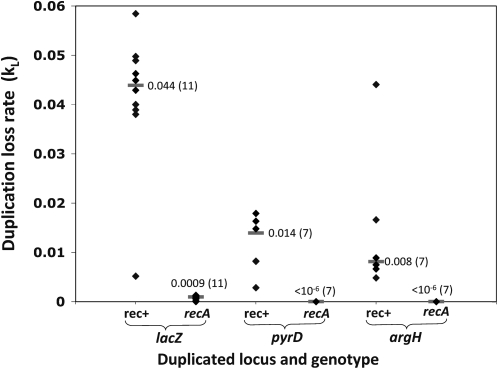
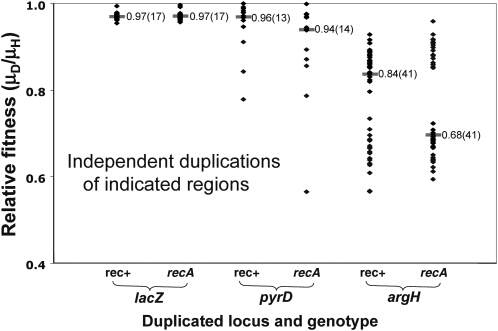
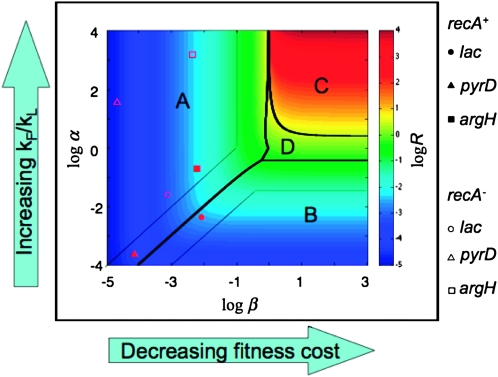
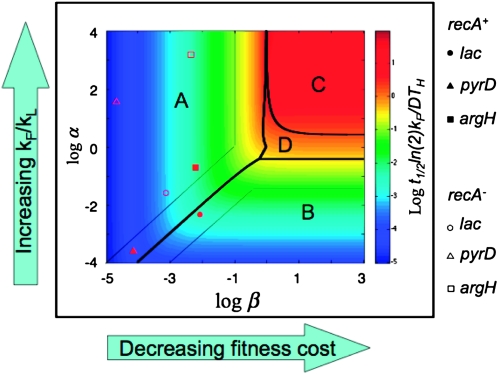
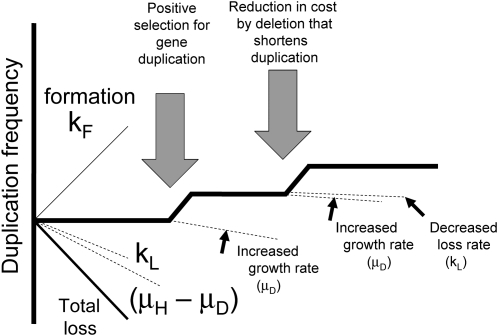
Tandem duplications are among the most common mutation events. The high loss rate of duplication suggested that the frequency of duplications in a bacterial population (1/1000) might reflect a steady state dictated by relative rates of formation (k(F)) and loss (k(L)). This possibility was tested for three genetic loci. Without homologous recombination (RecA), duplication loss rate dropped essentially to zero, but formation rate decreased only slightly and a steady state was still reached rapidly. Under all conditions, steady state was reached faster than predicted by formation and loss rates alone. A major factor in determining steady state proved to be the fitness cost, which can exceed 40% for some genomic regions. Depending on the region tested, duplications reached 40-98% of the steady-state frequency within 30 generations-approximately the growth required for a single cell to produce a saturated overnight culture or form a large colony on solid medium (10(9) cells). Long-term bacterial populations are stably polymorphic for duplications of every region of their genome. These polymorphisms contribute to rapid genetic adaptation by providing frequent preexisting mutations that are beneficial whenever imposed selection favors increases in some gene activity. While the reported results were obtained with the bacterium Salmonella enterica, the genetic implications seem likely to be of broader biological relevance.


Figures

F<sc>igure</sc> 1.—
Figure 1.—
Formation and loss of duplications. Duplications are thought to arise by exchanges between separated elements on sister chromosomes. These elements vary in size from several base pairs to multiple kilobases. Once a duplication is in place, the extensive sequence repeats are subject to unequal recombination events between sister chromosomes that can lead to loss of the duplication (reversion) or to further increases in copy number (amplification). Both loss and further amplification are expected to occur at the same rate (kL).
F<sc>igure</sc> 2.—
Figure 2.—
Conditions maintaining a steady-state duplication frequency. (Top) Every chromosomal region is subject to duplication that converts a haploid cell (H) to one with a duplication (D). The concentrations of H and D cells increase with growth rate constants μH and μD. Haploid cells give rise to duplications with rate constant kF and diploids lose their duplication with the rate constant kL. (Middle) When growth rates of haploid and diploid cells are equal, duplication frequency is dictated by rates of formation and loss, since kFkL. (Bottom) When duplications cannot be lost by reversion (kL= 0), a steady state can be reached if duplication strains grow less rapidly than haploids and formation rate balances growth deficit.
F<sc>igure</sc> 3.—
Figure 3.—
Measured events in duplication formation and loss. The rate of duplication formation describes a variety of different events that provide two copies of the assayed locus. The rate of duplication loss is assayed for a particular duplication, which may or may not be typical of the whole collection.
F<sc>igure</sc> 4.—
Figure 4.—
Three genomic loci assayed for duplication accumulation. The argH locus is between direct-order copies of the 6.5-kb rrn genes. The lac locus lies between repeated direct-order copies of the IS3 element (∼131 kb apart) on a low copy conjugative plasmid (F′128), whose transfer replication origin is responsible for intense recombination on the plasmid (Seifert and Porter 1984b; Syvanen et al. 1986; Carter et al. 1992). The chromosomal pyrD locus is not flanked by major repeats and is likely to be typical of most regions of the chromosome.
F<sc>igure</sc> 5.—
Figure 5.—
Accumulation of duplications in long-term cultures. Cultures initiated with a single haploid cell grew in LB with constant dilution to maintain the culture in midlog phase. The duplication frequency was determined using the Ka-Kan assay. Circles are for a recA+ haploid parent and triangles are for a recA mutant parent. Since the duplication assay required a large population size, the earliest time point at which an assay could be made was 33 generations. The plotted lines describe the duplication accumulation predicted by a spreadsheet simulation using the measured D/H (at 33 generations) and the measured fitness cost and duplication loss rate. Measurement of these values is described in the text.
F<sc>igure</sc> 6.—
Figure 6.—
Estimated rate constants for duplication loss (kL). Duplication loss was measured during growth of single colonies on LB medium. Each data point represents one independently isolated duplication mutant and is the median value of five subclones of that mutant (SD < 38%). The data show the variation between different duplications. The bars indicate the median loss rate of the different assayed duplication mutants, followed (in parentheses) by the total number of duplications assayed.
F<sc>igure</sc> 7.—
Figure 7.—
Fitness costs of duplications. Relative fitness is defined as the ratio of the growth rates of a duplication strain to that of its haploid parent (μDH). All tested duplications were isolated by the Ka-Kan selection (appendix a) and had a duplication with KanR Lac in one copy and KanS Lac+ in the other. Each point represents one independently isolated duplication mutant, whose presented relative growth rate is the average of three or more determinations (SD < 0.02). The median for each group of duplications is represented by a horizontal bar; the total number of different duplications assayed is in parentheses. Some duplications arose in recA+ cells and others in recA mutants. To minimize duplication loss during growth, rate measurements were made after addition of a recA mutation, which reduces growth slightly but is assumed to have no effect on the relative fitness of haploid and duplication-bearing strains.
F<sc>igure</sc> 8.—
Figure 8.—
Design space diagram for visualizing effects of fitness and formation/loss on steady-state duplication frequency.
F<sc>igure</sc> 9.—
Figure 9.—
Design space diagram for visualizing effects of relative fitness (β) and formation/loss rates (α) on time required for duplication frequency (R) to reach one-half of the final steady state (t1/2).
F<sc>igure</sc> 10.—
Figure 10.—
Effects of selection and duplication remodeling on steady-state frequency. The steady-state duplication frequency is determined (at left) by a balance between rate of formation (kF) on one hand and combined rates of loss (kL) and counterselection on the other hand. This steady-state frequency is expected to increase if conditions change so that some gene in the duplicated region provides a fitness increase. The frequency increase is expected even if the benefit is smaller than the cost, because cost is offset by formation. Frequency is also expected to increase if the size of the repeated unit is reduced by deletions, which should both reduce fitness cost and the rate of duplication loss kL.
F<sc>igure</sc> A1.—
Figure A1.—
The T-Recs method for detecting duplications in a recA mutant strain. A transduction cross introduces a copy of the argH region with an inserted CamR marker (T-Recs). This insertion includes a recA+ gene in addition to the determinants for chloramphenicol resistance. When transduced into a recA mutant recipient, this element expresses RecA, which can support the recombination needed for acquisition of the donor insertion mutation. The duplication frequency is the fraction of CamR transductants that remain Arg+.
F<sc>igure</sc> A2.—
Figure A2.—
The Ka-Kan assay: a Red-mediated transformation to detect duplications in the absence of RecA. In this assay, a donated fragment includes a promoter for the Kan resistance gene and flanking homology to the Kan gene on the left and to the lacZ gene on the right. Inheritance of this fragment converts a KanS Lac+ allele to a KanR Lac allele. Recipients with two copies of the lac region acquire KanR (in one copy) without loss of the Lac+ phenotype (provided by the other copy).
F<sc>igure</sc> A3.—
Figure A3.—
The drug-in-drug assay for detecting duplications in recA mutant strains. The locus to be assayed carries an inserted TetR gene that is disrupted by a KanR cassette. The assay strain carries this compound allele and a plasmid that encodes the Red functions of phage lambda (Yu et al. 2003). The assay consists of a transformation cross in which a single-stranded donor fragment is electroporated into the recipient assay strain. This fragment displaces the KanR determinant and repairs the TetR determinant, thereby converting a KanR, TetS allele into a KanS, TetR allele. Recipients with a duplication of the test locus gain TetR (in one copy of the region) while retaining the KanR phenotype (provided by the other copy).
F<sc>igure</sc> B1.—
Figure B1.—
The diagrammed process shows the number of haploid cells (H) increases by growth (μH) and when a duplication-bearing cell loses its duplication (μDkL). Haploid cells can be lost when a duplication arises (μHkF). Duplication cell number (D) increases by growth (μD) and when a duplication forms in a haploid cell (μHkF). Duplications can be lost by reversion (i.e. recombination between repeats) as diagrammed in Figure 2 (μDkL). The duplication frequency (R = D/H) rises to a steady state (R) at which point the difference between duplication formation and loss is balanced by the differences between diploid and haploid growth rates.
F<sc>igure</sc> B2.—
Figure B2.—
Graphical representation of the design space (Savageau et al. 2009) for the model in Figure A1. The horizontal axis represents the contribution of fitness cost (proportional to 1/β) to the steady-state duplication frequency. The vertical axis represents the contribution of duplication formation and loss (proportional to α) to the steady-state duplication frequency. The boundaries between regions in which the steady-state duplication frequency R is dominated by different forms of the solution are shown as heavy black lines.

References

    1. Anderson, P., and J. Roth, 1981. Spontaneous tandem genetic duplications in Salmonella typhimurium arise by unequal recombination between rRNA (rrn) cistrons. Proc. Natl. Acad. Sci. USA 78 3113–3117. - PMC - PubMed
    1. Anderson, R. P., and J. R. Roth, 1977. Tandem genetic duplications in phage and bacteria. Annu. Rev. Microbiol. 31 473–505. - PubMed
    1. Anderson, R. P., and J. R. Roth, 1979. Gene duplication in bacteria: alteration of gene dosage by sister-chromosome exchanges. Cold Spring Harbor Symp. Quant. Biol. 43(Pt. 2): 1083–1087. - PubMed
    1. Andersson, D. I., E. S. Slechta and J. R. Roth, 1998. Evidence that gene amplification underlies adaptive mutability of the bacterial lac operon. Science 282 1133–1135. - PubMed
    1. Bachellier, S., J. M. Clement and M. Hofnung, 1999. Short palindromic repetitive DNA elements in enterobacteria: a survey. Res. Microbiol. 150 627–639. - PubMed

Publication types