

Myelin basic protein priming reduces the expression of Foxp3 in T cells via nitric oxide
- PMID: 20083653
- PMCID: PMC2855656
- DOI: 10.4049/jimmunol.0804394
Myelin basic protein priming reduces the expression of Foxp3 in T cells via nitric oxide
Abstract
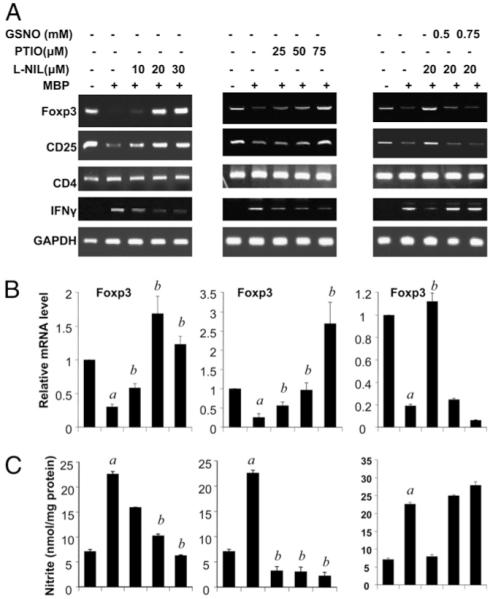
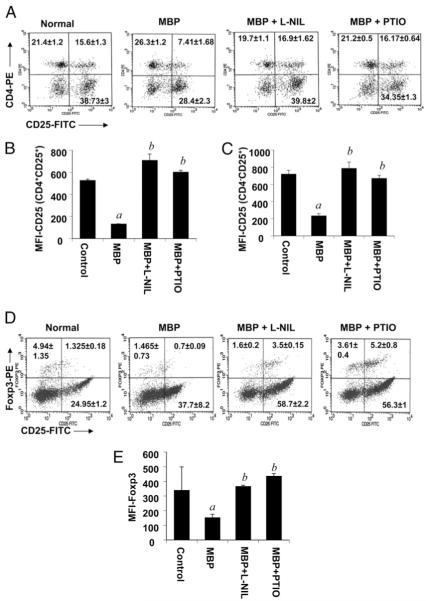
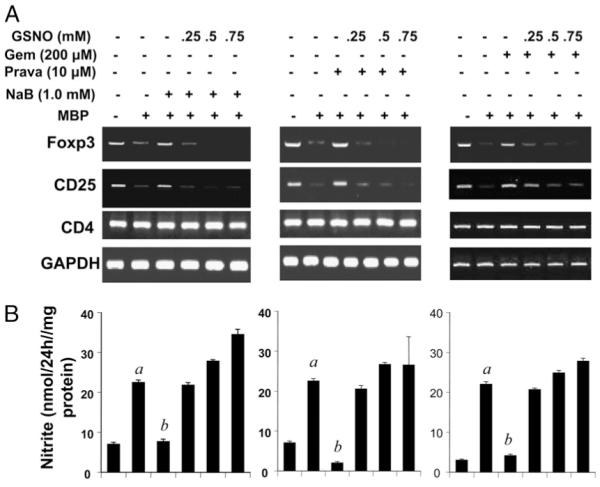
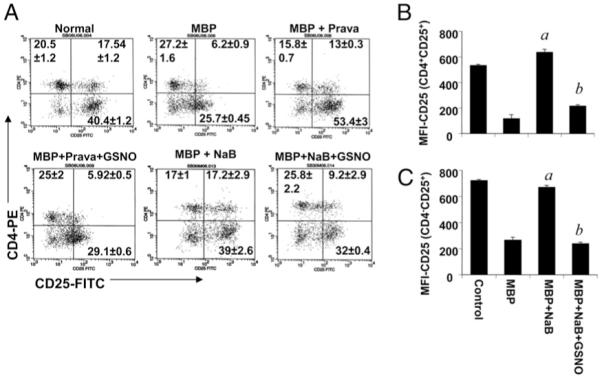
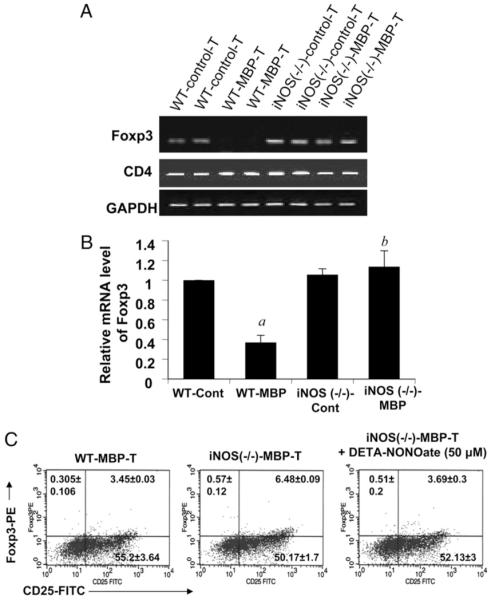
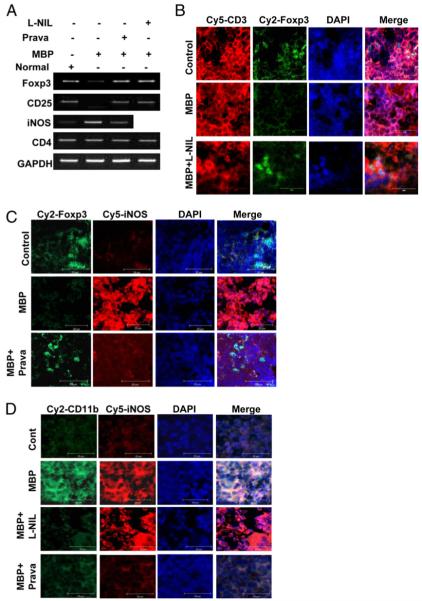
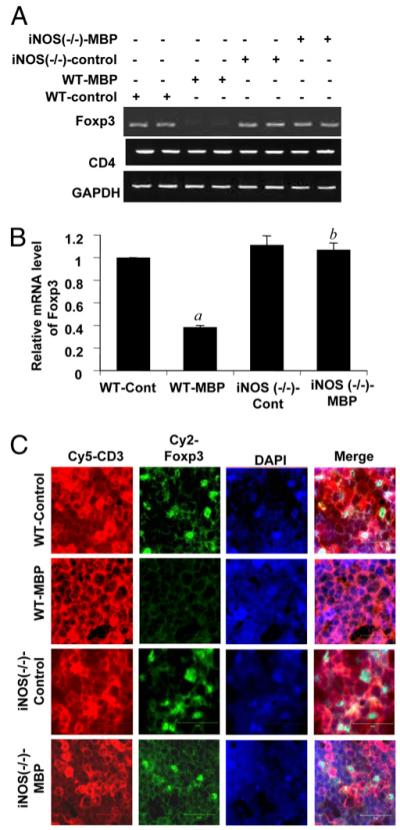
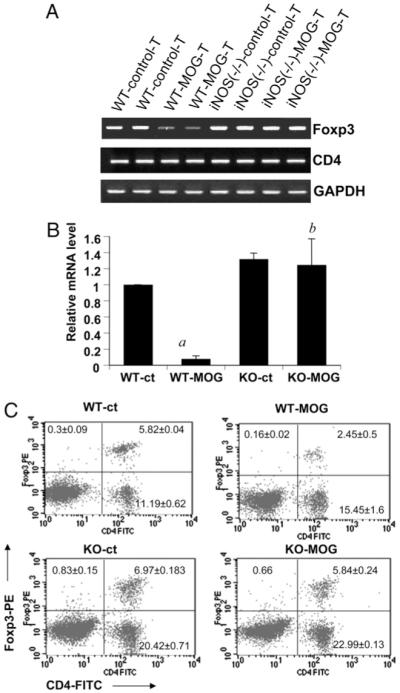
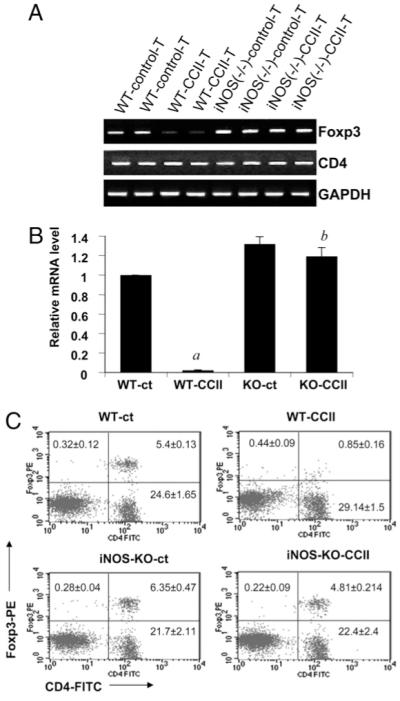
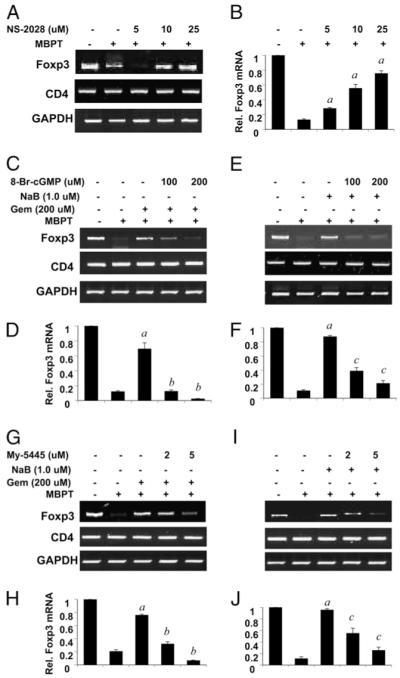
Regulatory T cells (Tregs) play a vital role in autoimmune disorders. Among several markers, forkhead box p3 (Foxp3) is the most specific with regard to Treg activity. Therefore, understanding mechanisms that regulate Foxp3 expression is a critical step for unraveling the complicacy of autoimmune pathophysiology. The present study was undertaken to investigate the crosstalk between NO and Tregs. Interestingly, after myelin basic protein (MBP) priming, the expression of Foxp3 decreased in MBP-primed T cells. However, blocking NO either by inhibiting inducible NO synthase with l-N(6)-(1-iminoethyl)-lysine hydrochloride or through scavenging with PTIO or by pharmacological drugs, such as pravastatin, sodium benzoate, or gemfibrozil, restored the expression of Foxp3 in MBP-primed T cells. However, this restoration of Foxp3 by pharmacological drugs was reversed by S-nitrosoglutathione, an NO donor. Similarly, NO also decreased the populations of Tregs characterized by CD4(+)CD25(+) and CD25(+)FoxP3(+) phenotypes. We have further confirmed this inverse relationship between NO and Foxp3 by analyzing the mRNA expression of Foxp3 and characterizing CD25(+)FoxP3(+) or CD4(+)Foxp3(+) phenotypes from inducible NO synthase knockout mice. Moreover, this inverse relation between NO and Foxp3 also was observed during priming with myelin oligodendrocyte glycoprotein, another target neuroantigen in multiple sclerosis, as well as collagen, a target autoantigen in rheumatoid arthritis. Finally, we demonstrate that NO inhibited the expression of Foxp3 in MBP-primed T cells via soluble guanylyl cyclase-mediated production of cGMP. Taken together, our data imply a novel role of NO in suppressing Foxp3(+) Tregs via the soluble guanylyl cyclase pathway.
Figures
Similar articles
-
A GMCSF-Neuroantigen Tolerogenic Vaccine Elicits Systemic Lymphocytosis of CD4+ CD25high FOXP3+ Regulatory T Cells in Myelin-Specific TCR Transgenic Mice Contingent Upon Low-Efficiency T Cell Antigen Receptor Recognition.Front Immunol. 2019 Jan 10;9:3119. doi: 10.3389/fimmu.2018.03119. eCollection 2018. Front Immunol. 2019. PMID: 30687323 Free PMC article.
-
Suppression of regulatory T cells by IL-12p40 homodimer via nitric oxide.J Immunol. 2009 Aug 1;183(3):2045-58. doi: 10.4049/jimmunol.0800276. Epub 2009 Jul 8. J Immunol. 2009. PMID: 19587012 Free PMC article.
-
Engineered MBP-specific human Tregs ameliorate MOG-induced EAE through IL-2-triggered inhibition of effector T cells.J Autoimmun. 2018 Aug;92:77-86. doi: 10.1016/j.jaut.2018.05.003. Epub 2018 May 30. J Autoimmun. 2018. PMID: 29857928 Free PMC article.
-
Latency-associated peptide identifies a novel CD4+CD25+ regulatory T cell subset with TGFbeta-mediated function and enhanced suppression of experimental autoimmune encephalomyelitis.J Immunol. 2008 Jun 1;180(11):7327-37. doi: 10.4049/jimmunol.180.11.7327. J Immunol. 2008. PMID: 18490732 Free PMC article.
-
Epigenetic mechanisms of regulation of Foxp3 expression.Blood. 2009 Oct 29;114(18):3727-35. doi: 10.1182/blood-2009-05-219584. Epub 2009 Jul 29. Blood. 2009. PMID: 19641188 Free PMC article. Review.
Cited by
-
Protection of Tregs, suppression of Th1 and Th17 cells, and amelioration of experimental allergic encephalomyelitis by a physically-modified saline.PLoS One. 2012;7(12):e51869. doi: 10.1371/journal.pone.0051869. Epub 2012 Dec 20. PLoS One. 2012. PMID: 23284794 Free PMC article.
-
Prospects of Cinnamon in Multiple Sclerosis.J Mult Scler (Foster City). 2015;2(3):1000149. doi: 10.4172/2376-0389.1000149. J Mult Scler (Foster City). 2015. PMID: 26380380 Free PMC article. No abstract available.
-
Suppression of Experimental Autoimmune Encephalomyelitis in Mice by β-Hydroxy β-Methylbutyrate, a Body-Building Supplement in Humans.J Immunol. 2023 Jul 15;211(2):187-198. doi: 10.4049/jimmunol.2200267. J Immunol. 2023. PMID: 37314416 Free PMC article.
-
Sodium Benzoate, a Food Additive and a Metabolite of Cinnamon, Enriches Regulatory T Cells via STAT6-Mediated Upregulation of TGF-β.J Immunol. 2016 Oct 15;197(8):3099-3110. doi: 10.4049/jimmunol.1501628. Epub 2016 Sep 7. J Immunol. 2016. PMID: 27605008 Free PMC article.
-
Cinnamon ameliorates experimental allergic encephalomyelitis in mice via regulatory T cells: implications for multiple sclerosis therapy.PLoS One. 2015 Jan 8;10(1):e0116566. doi: 10.1371/journal.pone.0116566. eCollection 2015. PLoS One. 2015. PMID: 25569428 Free PMC article.
References
-
- Coffer PJ, Burgering BM. Forkhead-box transcription factors and their role in the immune system. Nat. Rev. Immunol. 2004;4:889–899. - PubMed
-
- Beissert S, Schwarz A, Schwarz T. Regulatory T cells. J. Invest. Dermatol. 2006;126:15–24. - PubMed
-
- Shevach EM, Stephens GL. The GITR-GITRL interaction: co-stimulation or contrasuppression of regulatory activity? Nat. Rev. Immunol. 2006;6:613–618. - PubMed
-
- Brunkow ME, Jeffery EW, Hjerrild KA, Paeper B, Clark LB, Yasayko SA, Wilkinson JE, Galas D, Ziegler SF, Ramsdell F. Disruption of a new forkhead/winged-helix protein, scurfin, results in the fatal lymphoproliferative disorder of the scurfy mouse. Nat. Genet. 2001;27:68–73. - PubMed
-
- Wildin RS, Ramsdell F, Peake J, Faravelli F, Casanova JL, Buist N, Levy-Lahad E, Mazzella M, Goulet O, Perroni L, et al. X-linked neonatal diabetes mellitus, enteropathy and endocrinopathy syndrome is the human equivalent of mouse scurfy. Nat. Genet. 2001;27:18–20. - PubMed
Publication types
MeSH terms
Substances
Grants and funding
LinkOut - more resources
Full Text Sources
Other Literature Sources
Molecular Biology Databases
Research Materials
Miscellaneous
