Comparative Study
. 2010 Feb 15;184(4):1918-30.
doi: 10.4049/jimmunol.0903059. Epub 2010 Jan 18.

T cell/transmembrane, Ig, and mucin-3 allelic variants differentially recognize phosphatidylserine and mediate phagocytosis of apoptotic cells

Affiliations
Comparative Study

T cell/transmembrane, Ig, and mucin-3 allelic variants differentially recognize phosphatidylserine and mediate phagocytosis of apoptotic cells

Rosemarie H DeKruyff et al. J Immunol. .

Abstract

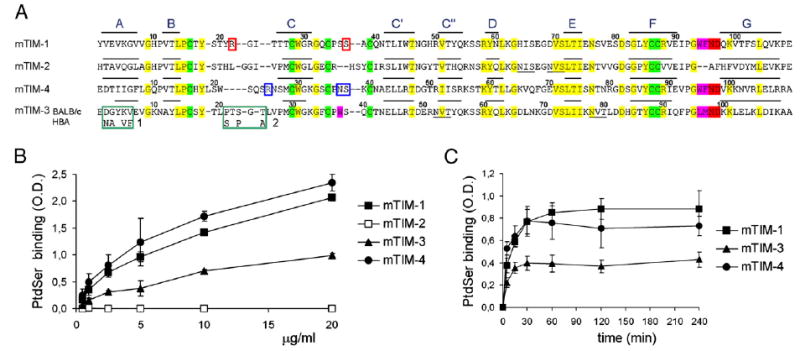
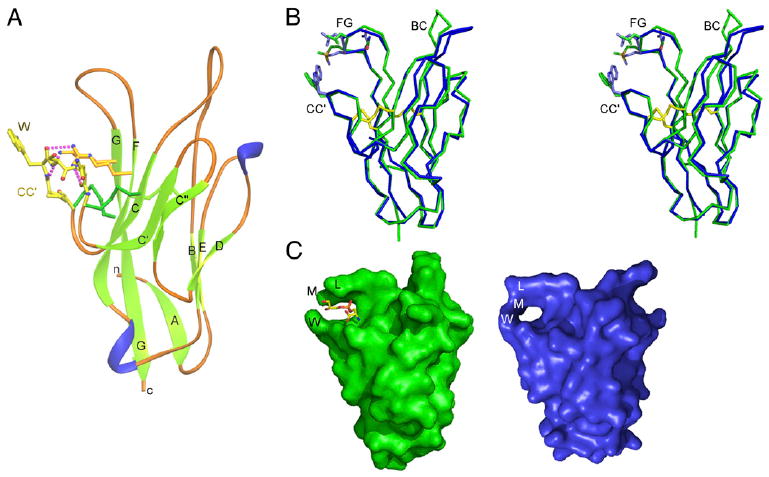
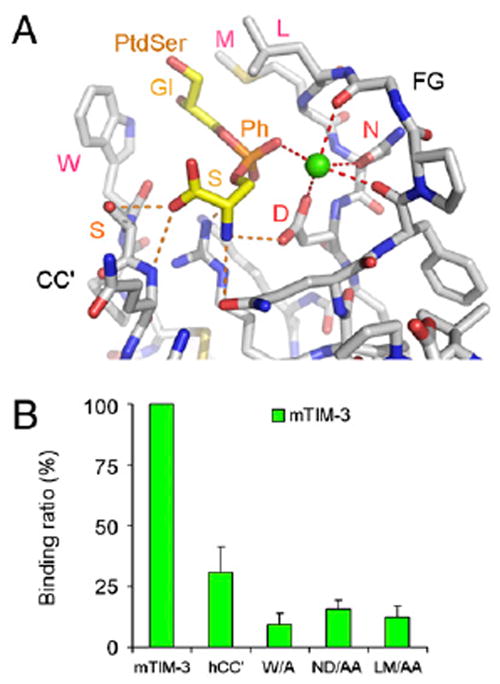
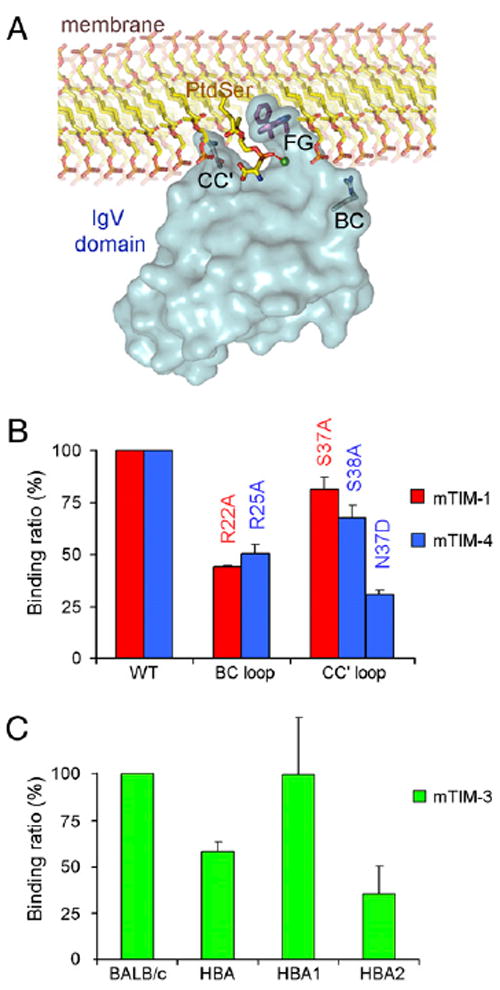
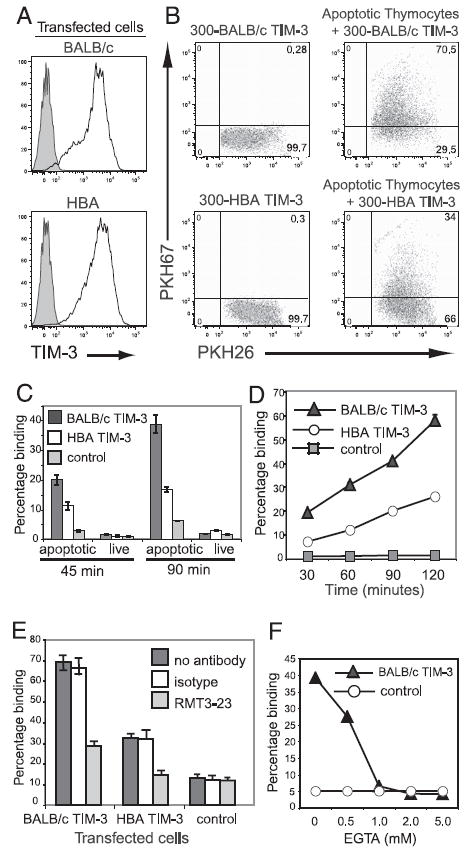
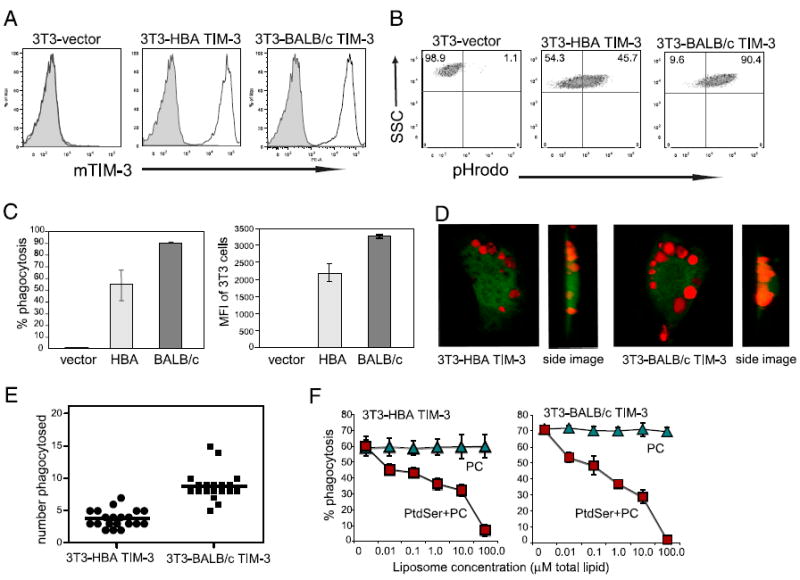
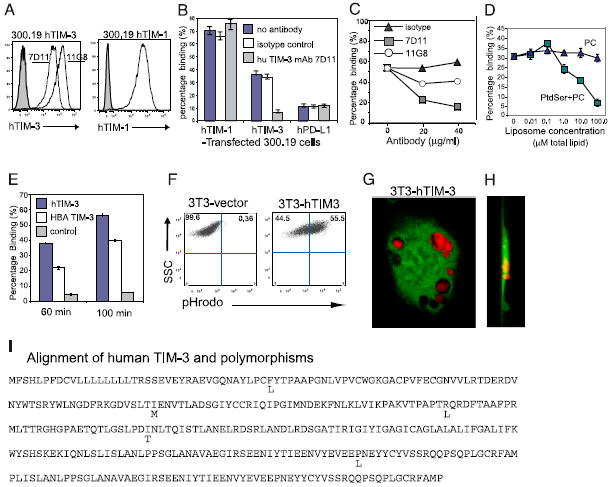
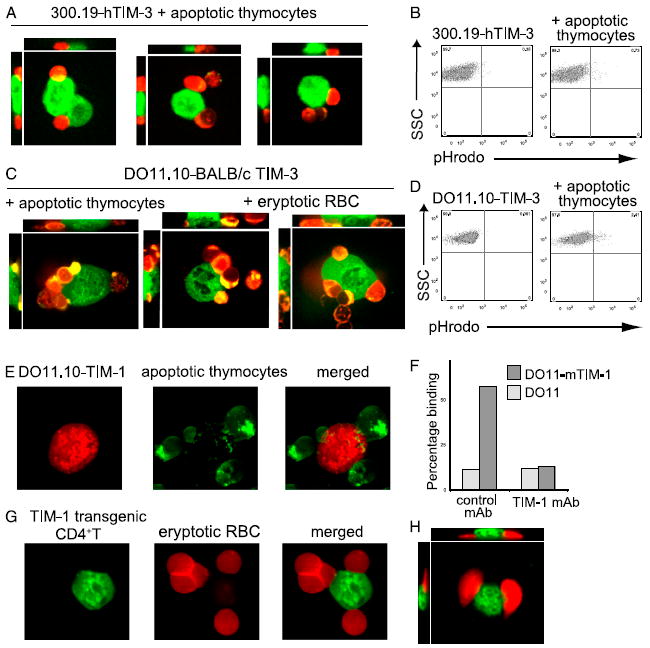
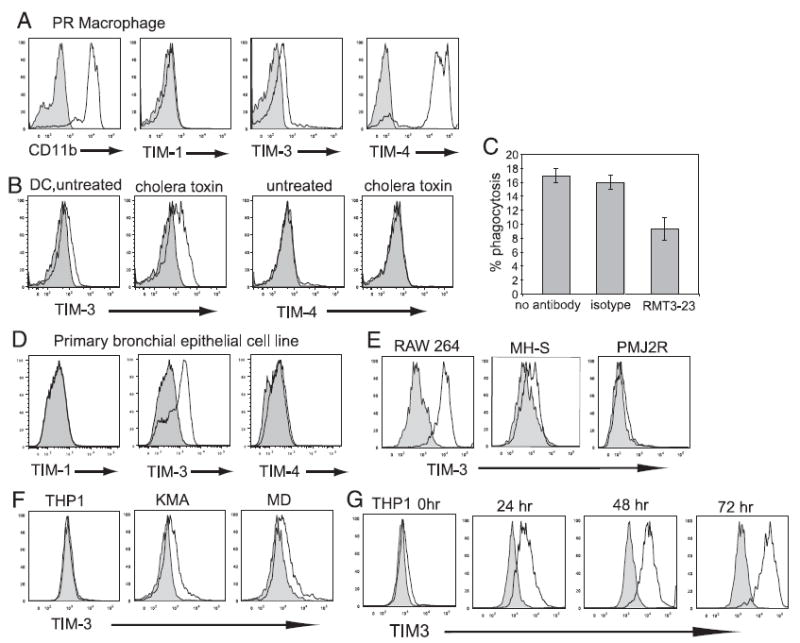
T cell/transmembrane, Ig, and mucin (TIM) proteins, identified using a congenic mouse model of asthma, critically regulate innate and adaptive immunity. TIM-1 and TIM-4 are receptors for phosphatidylserine (PtdSer), exposed on the surfaces of apoptotic cells. Herein, we show with structural and biological studies that TIM-3 is also a receptor for PtdSer that binds in a pocket on the N-terminal IgV domain in coordination with a calcium ion. The TIM-3/PtdSer structure is similar to that of TIM-4/PtdSer, reflecting a conserved PtdSer binding mode by TIM family members. Fibroblastic cells expressing mouse or human TIM-3 bound and phagocytosed apoptotic cells, with the BALB/c allelic variant of mouse TIM-3 showing a higher capacity than the congenic C.D2 Es-Hba-allelic variant. These functional differences were due to structural differences in the BC loop of the IgV domain of the TIM-3 polymorphic variants. In contrast to fibroblastic cells, T or B cells expressing TIM-3 formed conjugates with but failed to engulf apoptotic cells. Together these findings indicate that TIM-3-expressing cells can respond to apoptotic cells, but the consequence of TIM-3 engagement of PtdSer depends on the polymorphic variants of and type of cell expressing TIM-3. These findings establish a new paradigm for TIM proteins as PtdSer receptors and unify the function of the TIM gene family, which has been associated with asthma and autoimmunity and shown to modulate peripheral tolerance.


Conflict of interest statement

Disclosures The authors have no financial conflicts of interest.

Figures

FIGURE 1
FIGURE 1
TIM-3 has a MILIBS motif and binds to PtdSer. A, Structural alignment of mTIM IgV domain structures. The reported structures of mTIM-1 (PDB ID: 2OR8), mTIM-2 (PDB ID: 2OR7), and mTIM-4 (PDB ID: 3BIB) and the mTIM-3 structure presented in Fig. 2 (PDB ID: 3KAA) were aligned using the program malign3d (http://salilab.org/modeller/modeller.html) with a gap penalty of 3. β-Strands are shown with lines over the corresponding sequence and their names on top. N-linked glycosylation sites are underlined. Cysteines conserved in all of the TIMs and amino acids conserved in most TIMs are highlighted in green and yellow, respectively. The MILIBS residues engaged in metal ion coordination (ND) and the hydrophobic residues in the FG loop are highlighted in red and magenta, respectively. The Trp residue in the tip of the mTIM-3 CC′ loop is also shown in magenta. The two polymorphic regions (1 and 2) in BALB/c and HBA TIM-3 are indicated by green boxes. Residues mutated in mTIM-1 and mTIM-4 proteins for the PtdSer binding analysis shown in Fig. 4 are marked with red and blue boxes, respectively. B, Binding of mTIM-Fc proteins to PtdSer in liposomes. Binding of soluble Fc fusion proteins with the complete extracellular region to liposomes immobilized on plastic at 37°C was monitored by OD at 492 nm (see Materials and Methods). C, Binding of mTIM-Fc (5 μg/ml) proteins to PtdSer over time. Binding was monitored as in B at the indicated times at room temperature. Mean ± SD of three experiments is shown in B and C.
FIGURE 2
FIGURE 2
Crystal structure of the N-terminal IgV domain of mTIM-3 in complex with PtdSer. A, Ribbon diagram of the mTIM-3 IgV domain structure determined in complex with PtdSer. β-Strands are labeled with uppercase letters and shown in light green, whereas the loops are orange and helices are blue. N- and C-terminal ends are marked with lowercase letters. The CC′ loop having a Trp residue at the tip is shown in a ball-and-stick representation with carbons in yellow. The noncanonical Cys residues present in all of the TIM proteins and the disulfide bonds bridging the CC′ to the C and F β-strands are shown with dark green sticks, whereas the Arg and Lys residues interacting with the tip of the CC′ loop are shown with carbons in orange. Hydrogen bonds of the basic residue with the main chain carbonyl atoms of the loop are shown as pink dashed sticks. B, Stereoview of the superimposed N-terminal IgV domains of the mTIM-3 structures with PtdSer bound (green) and without PtdSer (blue). Cα traces of the domains are shown, with cysteines and disulfide bonds displayed as yellow sticks. Loops at the top of the domain are labeled. The side chains of residues in the tips of CC′ (Trp) and FG (Leu and Met) loops and the conserved Asn in the FG loop are shown (sequence in Fig. 1A). C, Surface representation of the mTIM-3 IgV domain structures determined with PtdSer bound(PDB ID: 3KAA) (left) and without PtdSer (PDB ID: 2OYP) (right). The PtdSer molecule bound to the MILIBS cavity is shown in stick representation with carbons in yellow, phosphate in orange, oxygens in red, and nitrogens in blue.
FIGURE 3
FIGURE 3
Binding of PtdSer to the MILIBS in the mTIM-3 IgV domain. A, Detailed view of the mTIM-3 MILIBS structure with a bound DCPtdSer molecule. Stick representation of the DCPtdSer (carbons in yellow) bound to the MILIBS pocket built by the tips of the CC′ and FG loops of the N-terminal IgV domain of mTIM-3 (carbons in gray). The DCPtdSer molecule is shown colored as in Fig. 2C and with the glycerol, phosphate, and serine moieties labeled. The metal ion coordinated to the phosphate of DCPtdSer and conserved residues of the FG loop is shown as a green sphere. Coordinations are shown as dashed red lines, whereas hydrogen bonds between the DCPtdSer molecule and the protein are orange dashed lines. Some of the mTIM-3 residues interacting with DCPtdSer and metal ion are labeled. B, Binding of mTIM-3 MILIBS mutants to PtdSer. Relative binding (%) of the mutants compared with that of the wild-type BALB/c TIM-3-Fc protein has been plotted. Binding of the mTIM-3-Fc proteins to PtdSer in liposomes was carried out for a range of protein concentrations as described in Fig. 1B and Materials and Methods. The hCC′ mTIM-3 mutant has the tip region of the CC′ loop (WSQ) replaced with the homologous hTIM-3 sequence (VFE). Mutations include residues at the tip of the loops interacting with the apolar chain of DCPtdSer (W/A or LM/AA) or coordinating with the metal ion (ND/AA), as labeled in Fig. 3A. Mean ± SD of three experiments is shown.
FIGURE 4
FIGURE 4
Model for TIM protein binding to PtdSer in a membrane and contribution of the mTIM-3 polymorphisms to the binding interaction. A, Surface representation of the structure of the IgV domain of mTIM-4 bound to PtdSer (PDB ID: 3BIB) is shown with a phospholipid bilayer membrane. Side chains at the tips of the labeled loops are shown: Arg in the BC loop, Asn-Ser in the CC′ loop, and Trp-Phe in the FG loop. The PtdSer and phospholipids are shown in stick representation as described in Fig. 3A. The hydrophilic head moiety of PtdSer penetrates into the MILIBS where the phosphate coordinates with the metal ion (green sphere). The critical contribution of the hydrophobic residues in the tips of the CC′ and FG loops that interact with the hydrophobic moiety of PtdSer, shown for mTIM-3 (Fig. 3A, 3B) and elsewhere for mTIM-4 (8, 11), suggests that they must penetrate the lipid bilayer upon TIM protein binding to PtdSer. The BC loop comes close to the charged head of the phospholipids. B, Contribution of the BC and CC′ loops of mTIM-1 and mTIM-4 to binding to PtdSer in liposomes. Relative binding (%) to the wild-type mTIM-1 and mTIM-4 proteins of mutants with the indicated residue substitution in the loops. Mutated residues are boxed in Fig. 1A. C, Contribution of mTIM-3 polymorphisms to the PtdSer binding interaction. Relative binding (%) to BALB/c TIM-3 is shown for the HBA TIM-3 protein and for the HBA1 and HBA2 mutants, which are BALB/c TIM-3 proteins containing the boxed HBA polymorphisms labeled as 1 and 2 in Fig. 1A. Binding of the mTIM-Fc fusion proteins to PtdSer in liposomes was carried out for a range of protein concentrations as described in Fig. 1B and Materials and Methods. Mean ± SD of three experiments is shown in B and C.
FIGURE 5
FIGURE 5
BALB/c TIM-3–transfected cells bind apoptotic cells better than HBA TIM-3–transfected cells. A, The 300.19 cells stably transfected with BALB/c or HBA TIM-3 were stained with TIM-3 mAb RMT3-23 and analyzed by flow cytometry, gating on live cells. B, PKH67-labeled apoptotic thymocytes and PKH26-labeled BALB/c TIM-3–transfected 300.19 cells were incubated for 90 min and analyzed by flow cytometry for binding of labeled cells. Fluorescence profiles of BALB/c or HBA TIM-3–transfected cells alone (left) and analysis of the coculture (right) are shown. Percentage of transfected cells binding PKH67-labeled apoptotic cells is determined by gating on the forward light scatter/side light scatter high population of 300.19 cells and analyzing dual fluorescence. C, Binding of apoptotic or live thymocytes by BALB/c TIM-3–transfected, HBA TIM-3–transfected, or control PD-L1–transfected 300.19 cells. Cells were labeled and analyzed as in B. Percentage of transfected cells binding PKH67-labeled thymocytes is plotted. D, Time course of binding of apoptotic thymocytes by BALB/c TIM-3–transfected, HBA TIM-3–transfected, or control PD-L1–transfected 300.19 cells. Cells were labeled and analyzed as in B at the indicated times. E, Blockade of apoptotic cell binding by TIM-3 mAb. Transfected cells were preincubated for 30 min with TIM-3 mAb RMT3-23 or isotype control followed by PKH67-labeled apoptotic thymocytes for 90 min. F, Binding of apoptotic cells by BALB/c TIM-3–transfected 300.19 cells was measured as described above, in media containing the indicated concentrations of EGTA. All of the binding assays were done in triplicate, and mean values are plotted with SD and are representative of three or more experiments.
FIGURE 6
FIGURE 6
BALB/c TIM-3 mediates phagocytosis of apoptotic cells better than HBA TIM-3. A, TIM-3 expression on BALB/c and HBA TIM-3 NIH 3T3 transfectants. NIH 3T3 cells stably transfected with HBA TIM-3, BALB/c TIM-3, or vector were stained with PE-conjugated anti–mTIM-3 mAb RMT3-23 (heavy line) or PE-conjugated isotype control Ab (shaded histogram) and analyzed by flow cytometry. B, TIM-3–mediated phagocytosis of apoptotic cells. HBA TIM-3, BALB/c TIM-3, and vector-transfected NIH 3T3 cells were incubated with pHrodo-labeled apoptotic thymocytes for 3 h, washed three times, detached with PBS with 0.5 mM EDTA, and analyzed by flow cytometry. Dot plots are shown with the percentage of transfected cells that have phagocytosed apoptotic cells indicated in the upper right quadrant. C, Percentage and mean fluorescence intensity of TIM-3 3T3 cells that have phagocytosed pHrodo-labeled apoptotic cells. Data from three experiments are shown as mean ± SD. D, Confocal images of TIM-3–mediated phagocytosis. CMFDA-labeled NIH 3T3 transfectants were incubated with pHrodo-labeled apoptotic thymocytes for 3 h, washed three times, and fixed. E, The number of phagocytosed, pHrodo-labeled apoptotic thymocytes in TIM-3–transfected 3T3 cells were counted. Each data point represents an individual 3T3 cell visualized as in D. F, Phagocytosis of eryptotic RBCs by TIM-3–transfected 3T3 cells was inhibited by liposomes containing a 50:50 mix of PtdSer and PC but not by PC alone. The 3T3 cells were preincubated with liposomes for 15 min prior to addition of PKH26-labeled eryptotic RBCs for 45 min. Cells were washed and analyzed by flow cytometry. All of the experiments were repeated at least three times with similar results.
FIGURE 7
FIGURE 7
hTIM-3–transfected cells bind and phagocytose apoptotic cells. A, TIM-3 and TIM-1 expression on hTIM-3 and hTIM-1 transfected 300.19 cells. Cells stably transfected with hTIM-3 or hTIM-1 were stained with anti–hTIM-3 mAbs 7D11 or 11G8, hTIM-1 mAb, or isotype control Ab (shaded histogram), followed by PE-conjugated anti-mouse IgG, and analyzed by flow cytometry. B, PKH26-labeled hTIM-3–, hTIM-1–, or control PD-L1–transfected 300.19 cells were preincubated with hTIM-3 mAb 7D11 or isotype control for 30 min prior to addition of PKH67-labeled apoptotic thymocytes. Cells were cocultured for an additional 90 min and analyzed by flow cytometry. One experiment representative of three is shown. C, hTIM-3–transfected 300.19 cells were preincubated with the indicated concentrations of hTIM-3 mAb 7D11 or 11G8 or isotype control for 30 min prior to addition of PKH67-labeled apoptotic thymocytes. Cells were cocultured for an additional 90 min and analyzed by flow cytometry. D, Binding of apoptotic thymocytes by hTIM-3–transfected 300.19 cells was inhibited by liposomes containing a 50:50 mix of PtdSer and PC but not by PC alone. Transfected cells were preincubated with liposomes for 15 min prior to addition of PKH67-labeled apoptotic thymocytes for 30 min. Cells were analyzed by flow cytometry. E, Comparison of binding of apoptotic cells by hTIM-3– and mTIM-3–transfected 300.19 cells. F, hTIM-3–mediated phagocytosis of apoptotic cells. hTIM-3– and vector–transfected NIH 3T3 cells were incubated with pHrodo-labeled apoptotic thymocytes for 3 h, washed three times, detached with PBS with 0.5 mM EDTA, and analyzed by flow cytometry. Dot plots are shown with the percentage of transfected cells phagocytosing apoptotic cells indicated in the upper right quadrant. G and H, Confocal images of hTIM-3–mediated phagocytosis. CMFDA-labeled hTIM-3–transfected NIH 3T3 cells were incubated with pHrodo-labeled apoptotic thymocytes for 3 h, washed three times, and fixed, and images were obtained as described in Fig. 6. I, The hTIM-3 Refseq is shown with polymorphisms indicated below.
FIGURE 8
FIGURE 8
TIM-3–transfected lymphocytes bind but do not phagocytose apoptotic cells. A, CMFDA-labeled hTIM-3–transfected 300.19 cells (green) were cocultured with CMTMR-labeled apoptotic thymocytes (orange) for 60 min and visualized by confocal microscopy. B and D, Apoptotic thymocytes were labeled with the pH-sensitive dye pHrodo, incubated with hTIM-3–transfected 300.19 cells (B) or BALB/c TIM-3–transfected DO11.10 T hybridoma cells (D) for 2 h, and then washed. The engulfment of pHrodo-labeled apoptotic cells from the cell surface (colorless at neutral pH) into acidic cell compartments (red at acidic pH) was determined by flow cytometry. Dot plots are shown with the percentage of transfected cells phagocytosing apoptotic cells indicated in the upper right quadrant. Left panel shows DO11.10 or 300.19 cells incubated without apoptotic thymocytes; (right panel) cells incubated with apoptotic thymocytes. C, CMFDA-labeled BALB/c TIM-3–transfected DO11.10 T hybridoma cells (green) were cocultured with CMTMR-labeled apoptotic thymocytes or eryptotic RBCs (orange) for 60 min and visualized by confocal microscopy. Images of three DO11.10 cells with different trajectories of confocal sections are shown. Each set of three images shows one DO11.10 cell as follows: perpendicular view (bottom right); side view, longitudinal section (left); side view, horizontal section (top right). E, CMTMR-labeled mTIM-1–transfected DO11.10 hybridoma cells (orange) were cultured with PKH67-labeled apoptotic thymocytes (green) for 60 min and visualized by confocal microscopy. F, mTIM-1–transfected or untransfected DO11.10 T hybridoma cells were preincubated for 20 min with TIM-1 mAb 3B3 or isotype control followed by PKH67-labeled apoptotic thymocytes for 45 min. Flow cytometry was used to quantitate the binding. G, CD4+ T cells purified from a TIM-1 transgenic mouse were activated with anti-CD3 and anti-CD28 mAbs, then labeled with CMFDA (green), incubated with CMTMR-labeled eryptotic RBCs (red), and examined by confocal microscopy. H, Images of cells as in G. Eryptotic RBCs were localized outside the TIM-1+ CD4 T cell by the longitudinal (left panel) and perpendicular (upper panel) trajectories of three-dimensional confocal sections.
FIGURE 9
FIGURE 9
TIM-3 expression and inducibility in mouse and human cell lines. A, Expression of TIM-1, TIM-3, and TIM-4 in mouse peritoneal resident macrophages. Mouse peritoneal resident macrophages were enriched, stained with CD11b, TIM-1, TIM-3, and TIM-4 Abs, and analyzed by flow cytometry. Heavy line represents staining with specific mAb, and shaded histogram represents isotype control. B, BMDCs were exposed to 5 μg/ml cholera toxin for 24 h and analyzed for TIM expression. C, Cholera toxin-treated BMDCs were preincubated with TIM-3 mAb or isotype control followed by pHrodo-labeled apoptotic thymocytes for 1 h. Phagocytosis was analyzed by flow cytometry. D, Primary bronchial epithelial cell lines were analyzed for TIM expression. E and F, Mouse macrophage cell lines RAW264.7, MH-S, and PMJ2R (E) and human macrophage cell lines THP1, KMA, and MD (F) were stained with PE-conjugated anti–mTIM-3 mAb RMT3-23 or anti–hTIM-3 mAb 11G8, respectively, and analyzed by flow cytometry. Heavy line represents staining with TIM-3 mAb, and shaded histogram represents isotype control. G, Human macrophage cell line THP-1 was induced to differentiate by PMA (5 ng/ml), and cells were stained with PE-conjugated anti–hTIM-3 mAb 11G8 after 0, 24, 48, and 72 h and analyzed by flow cytometry. Heavy line represents staining with TIM-3 mAb, and shaded histogram represents isotype control. All of the experiments were repeated at least three times with similar results.

Similar articles

Cited by

References

    1. Rodriguez-Manzanet R, DeKruyff R, Kuchroo VK, Umetsu DT. The costimulatory role of TIM molecules. Immunol Rev. 2009;229:259–270. - PMC - PubMed
    1. Su EW, Lin JY, Kane LP. TIM-1 and TIM-3 proteins in immune regulation. Cytokine. 2008;44:9–13. - PMC - PubMed
    1. McIntire JJ, Umetsu SE, Akbari O, Potter M, Kuchroo VK, Barsh GS, Freeman GJ, Umetsu DT, DeKruyff RH. Identification of Tapr (an airway hyperreactivity regulatory locus) and the linked Tim gene family. Nat Immunol. 2001;2:1109–1116. - PubMed
    1. Kuchroo VK, Umetsu DT, DeKruyff RH, Freeman GJ. The TIM gene family: emerging roles in immunity and disease. Nat Rev Immunol. 2003;3:454–462. - PubMed
    1. McIntire JJ, Umetsu SE, Macaubas C, Hoyte EG, Cinnioglu C, Cavalli-Sforza LL, Barsh GS, Hallmayer JF, Underhill PA, Risch NJ, et al. Immunology: hepatitis A virus link to atopic disease. Nature. 2003;425:576. - PubMed

Publication types

MeSH terms

Associated data