. 2010 Feb;7(1):16008.
doi: 10.1088/1741-2560/7/1/016008. Epub 2010 Jan 19.

Chronic network stimulation enhances evoked action potentials

Affiliations

Chronic network stimulation enhances evoked action potentials

A N Ide et al. J Neural Eng. 2010 Feb.

Abstract

Neurons cultured on multielectrode arrays almost always lack external stimulation except during the acute experimental phase. We have investigated the effects of chronic stimulation during the course of development in cultured hippocampal neural networks by applying paired pulses at half of the electrodes for 0, 1 or 3 r/day for 8 days. Spike latencies increased from 4 to 16 ms as the distance from the stimulus increased from 200 to 1700 microm, suggesting an average of four synapses over this distance. Compared to no chronic stimulation, our results indicate that chronic stimulation increased evoked spike counts per stimulus by 50% at recording sites near the stimulating electrode and increased the instantaneous firing rate. On trials where both pulses elicited responses, spike count was 40-80% higher than when only one of the pulses elicited a response. In attempts to identify spike amplitude plasticity, we found mainly amplitude variation with different latencies suggesting recordings from neurons with different identities. These data suggest plastic network changes induced by chronic stimulation that enhance the reliability of information transmission and the efficiency of multisynaptic network communication.


Figures
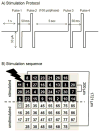
Figure 1
Figure 1. Stimulation and probe protocol
(A) Trains of 2 paired-pulse stimuli, separated by 5 s, 30 μA amplitude (positive first), 50 ms interpulse interval and 1 sec for switch time between electrodes. (B) The bottom half electrodes (unstimulated) are numbered according to column and row, G is the ground. The top half electrodes (stimulated) are numbered according to the fixed but pseudorandom stimulation sequence chosen to avoid stimulation of any two adjacent electrodes consecutively. The shortest distance between two electrodes is 200 μm (vertical or horizontal) and the furthest is 1721 μm.
Figure 2
Figure 2. Pharmacological analysis suggests that 11 x S.D. peak to peak is the best threshold for spike detection
Recordings were made before and after the addition of drugs to block synapses and sodium channels (APV, CNQX and TTX). Offline, the threshold for spike detection was varied as a multiple of S.D. of the noise. (A) Difference between active channels before/after drugs found substantial false positive detections when the threshold is 8–9 x S.D., but is reduced greatly at 10 x S.D. and maximally at 11 x S.D. (B) Percent false positive spikes were defined as those still seen after inhibitory drugs divided by those detected before drugs at each multiple of detection sensitivity (S.D.). As multiples increased, the first multiple with spike counts not significantly different from zero was at 11 x S.D., which maximized the number of true positives spikes and minimized false positives spikes. n=3 arrays.
Figure 3
Figure 3. Average number of active channels does not change with either chronic stimulation or distance from the stimulus
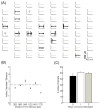
(A) Example of recordings from active channels during the probe stimulation; G is the grounding electrode; S is the current stimulating electrode. Channels in gray are inactive electrodes and channels in black are active (at least 1 evoked spike). (B) An average of 2.7 channels/stimulus (--) are active for each distance (200–1721 μm), independent of chronic stimulation (n=28 arrays). (C) Overall percent active channels for the 600 stimuli per array were 45–50% for 0 hr/day (n=8 arrays), 1 hr/day (n=8 arrays) and 3 hr/day (n=12 arrays).
Figure 4
Figure 4. In comparison to the unstimulated condition, chronic stimulation increases the probability of response without changing morphological properties of neurons cultured on MEAs
(A) Neuron distribution on an MEA after 21 days of culture in NbActiv4 for the unstimulated condition; (B) 1 hr/day chronic stimulation; and (C) 3 hr/day chronic stimulation. Corresponding data traces (n=10 overlapping traces each) are shown to the right according to the distance from the stimulation site. At short distance (283 μm), spike amplitudes are higher and latencies are shorter, when compared to responses at long distance (1721 μm). Stars (*) on the top of each trace indicate the spikes detected at the corresponding time.
Figure 5
Figure 5. Probability of an evoked response increases with chronic stimulation and decreases with distance from the stimulus
(A) Within 283 μm distance from the stimulus, 1hr/day chronic stimulation elicits 50% more responses than unstimulated condition and 35% for 3hr/day. (B) Probability of evoking a response decreases with distance from the stimulus. n ≥ 10,000 stimuli for each distance.
Figure 6
Figure 6. First spike latency increases with distance from the stimulus
(A) Examples of evoked responses at distances of 283 μm (left column) and 1721 μm (right column) from the stimulus. Responses at electrodes near the stimulus have similar latencies (i–iv, respectively for pulses 1–4 in sequence), while the ones localized far away have different latencies (v–viii, in sequence). Stars (*) on the top of each trace indicate the spikes detected at the corresponding time. (B) Coefficient of variation of latency with distance from the stimulus. Independent of chronic stimulation there is 2x more variability at long distances. 14000 > n > 800 for each distance. The n decreases when distance from the stimulus increases. (C) Overall average of first spike latency with distance from the stimulus. An asymptotic extrapolation shows that responses at electrodes within 283 μm of the stimulus first occur on average with a 4 ms delay (activation time for 1 synapse), and 1.2 ms delay for linear extrapolation (spike activation time). Electrodes at 1721 μm responded with a delay of 16 ms, suggesting 4 synapses.
Figure 7
Figure 7. The 2nd pulse increases spike amplitudes during chronic stimulation
(A) The change in the average amplitude of the first spike evoked by the 2nd pulse minus the corresponding average in response to the 1st pulse for 0, 1 and 3 hr/day chronic stimulation. (B) Examples of evoked responses (n=10 traces each) for 3hr/day chronic showing the lower amplitude for the evoked responses to the 1st pulse at 1721 μm distance from stimulus. Stars (*) on the top of each trace indicate the spikes detected at the corresponding time. (C) 0 hr/day: there is no difference between responses to the 1st & 2nd pulse. (D) 1hr/day, spike amplitudes elicited by the 2nd pulse are 10–15% higher than for the 1st pulse. (E) 3hr/day: responses to the 2nd pulse are unchanged across distance, despite a 25% amplitude decline with distance for responses to the 1st pulse. 8000 > n > 300 for each distance. The n decreases with distance from the stimulus. (F) Histogram of spike amplitudes evoked by the 1st (i) and the 2nd (ii) pulse at 1721 μm distance indicates a greater number of larger amplitude spikes. Insets: blow up from 50–200 μV.
Figure 8
Figure 8. Firing rate and spike amplitudes following the 2nd pulse are higher due to spillover from evoked bursts with higher amplitudes than those of isolated spikes
(A) The 1st pulse evoked a burst that began at 24–31 ms (Ai) and co+ntinues so as to overlap the arrival of the 2nd pulse at 53 ms (3 ms in Aii). Stars (*) indicate the position of the spikes detected in the corresponding traces; arrows (↑) indicate the first evoked spike; and the dashed lines (--) indicate the peak-to-peak amplitude of the first spike evoked by the 1st pulse. (B) Chronic stimulation increases instantaneous firing rate and (C) evokes more spikes at higher frequency (bin size 150 ms). (D) Spike amplitudes are larger in the first spike of ‘bursts’ than in single responses or mid-bursts (all spikes but the first).
Figure 9
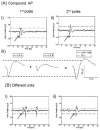
Figure 9. The 2nd pulse evokes responses with larger spike amplitudes due to the recruitment of different units and compound action potentials
(Ai-ii) The 2nd pulse evokes a larger amplitude spike, possibly arising from the sum of the two resolved spikes in Ai. Stars (*) indicate the position of the spikes detected in the corresponding traces; arrows (↑) indicate the first evoked spike; and the dashed lines (--) indicate the peak-to-peak amplitude of the first spike evoked by the 1st pulse. (Aiii) Comparison of the sum of the spike profiles in Ai at optimal time offset to the profile of the spike in Aii. (B) First spikes are recorded from different units, characterized by different latencies and spike shapes that do not sum as well.
Figure 10
Figure 10. The 2nd pulse does not induce spike amplitude plasticity, independent of the chronic stimulation and distance from the stimulus
Amplitude change when comparing evoked responses by the 1st to the 2nd pulse with distance from the stimulus, for (A) 0hr/day, (B) 1hr/day and (C) 3hr/day chronic stimulation. Evoked responses (60 < n < 2500) are separated by type, either same (within 0.5 ms)(△) or different latencies (>0.5 ms)(●). Evoked responses with same latencies did not have a significant change in amplitude, while the ones with different latencies presented an increase in the 2nd spike amplitude response with distance.
Figure 11
Figure 11. When 1st & 2nd pulses both evoke a response, more spikes with higher amplitudes are seen than when a pulse evokes only one response
(A) Examples of responses evoked by the 1st pulse only (i–ii), by the 2nd pulse (iii–iv) only, and by both pulses (v–vi). Stars (*) indicate the position of the spikes detected in the corresponding traces. (B) The number of evoked spikes (n > 10,000) and (C) the evoked spike amplitudes are higher when there are responses to both 1st and 2nd pulses.

Similar articles

Cited by

References

    1. Aradi I, Maccaferri G. Cell type-specific synaptic dynamics of synchronized bursting in the juvenile CA3 rat hippocampus. J Neurosci. 2004;24:9681–9692. - PMC - PubMed
    1. Atasoy D, Ertunc M, Moulder KL, Blackwell J, Chung C, Su J, Kavalali ET. Spontaneous and evoked glutamate release activates two populations of NMDA receptors with limited overlap. J Neurosci. 2008;28:10151–10166. - PMC - PubMed
    1. Bakkum DJ, Chao ZC, Potter SM. Long-term activity-dependent plasticity of action potential propagation delay and amplitude in cortical networks. PLoS ONE. 2008;3:e2088. - PMC - PubMed
    1. Beggs JM, Plenz D. Neuronal avalanches in neocortical circuits. The Journal of Neuroscience. 2003;23:11167–11177. - PMC - PubMed
    1. Berdondini L, Massobrio P, Chiappalone M, Tedesco M, Imfeld K, Maccione A, Gandolfo M, Koudelka-Hep M, Martinoia S. Extracellular recordings from locally dense microelectrode arrays coupled to dissociated cortical cultures. J Neurosci Methods 2008 - PubMed

Publication types