. 2010 Jan 12;8(1):e1000278.
doi: 10.1371/journal.pbio.1000278.

Coherence potentials: loss-less, all-or-none network events in the cortex

Affiliations

Coherence potentials: loss-less, all-or-none network events in the cortex

Tara C Thiagarajan et al. PLoS Biol. .

Erratum in

  • PLoS Biol. 2010;8(1). doi: 10.1371/annotation/668be458-400b-4c19-accf-34fc543340e2
  • PLoS Biol. 2010;8(1). doi: 10.1371/annotation/f6193dfe-a90c-4110-b0a0-22d81a87b921

Abstract

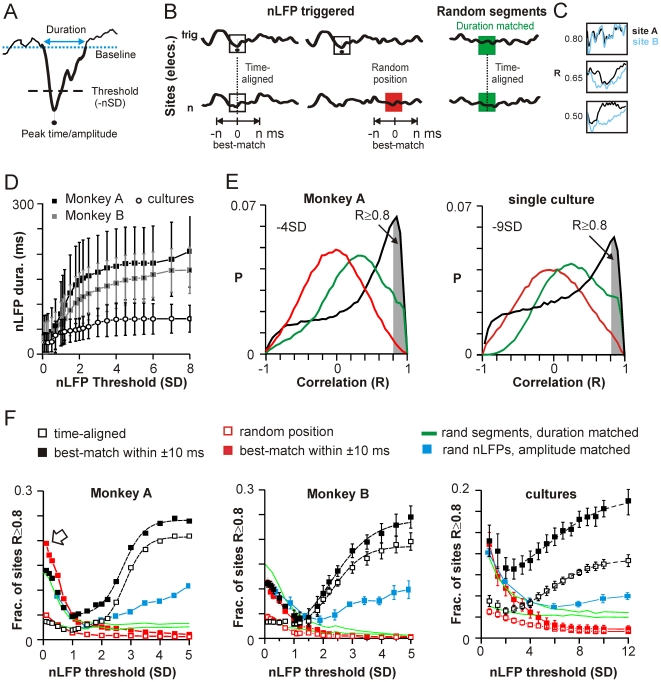
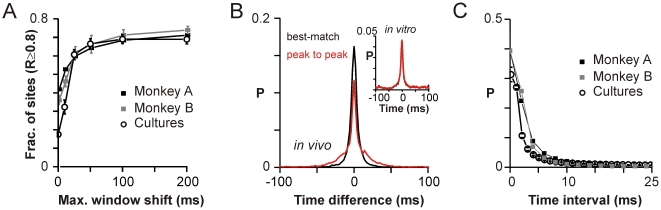
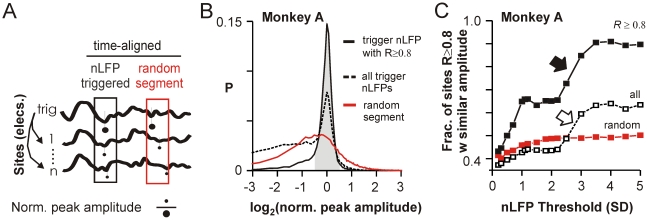
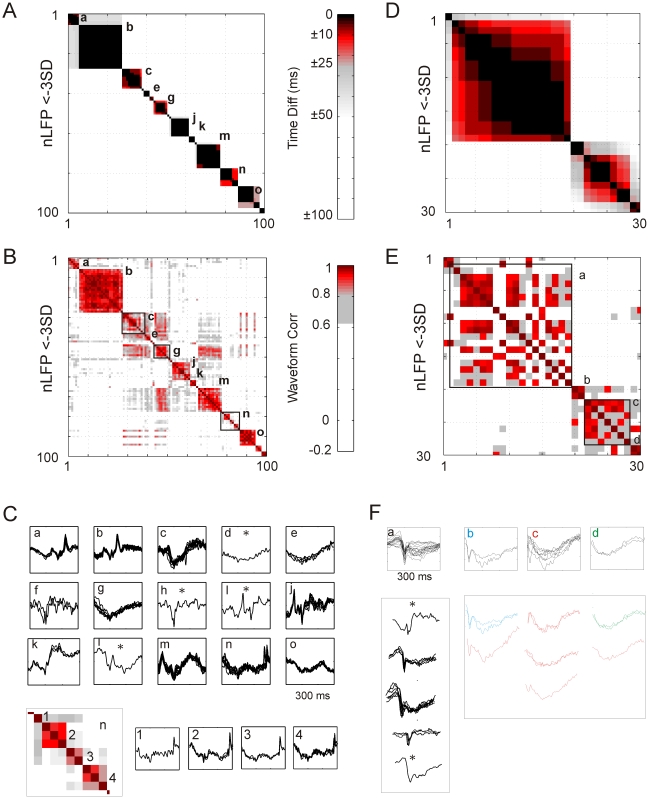
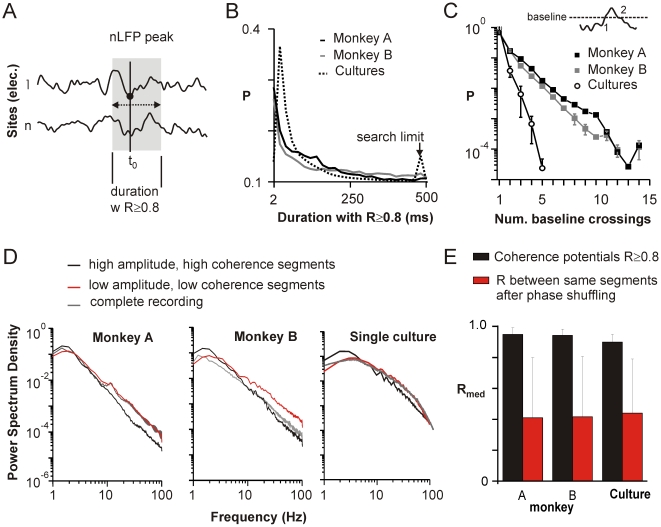
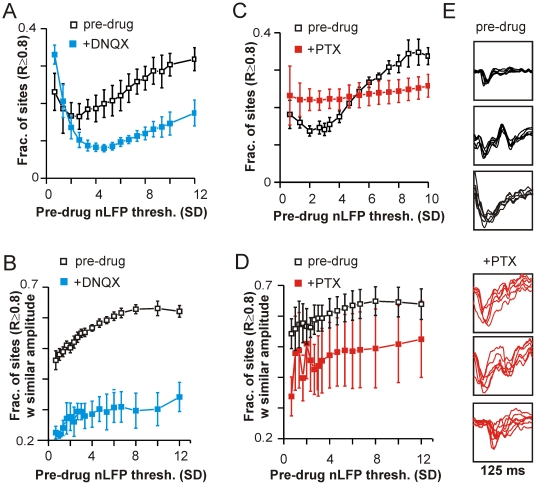
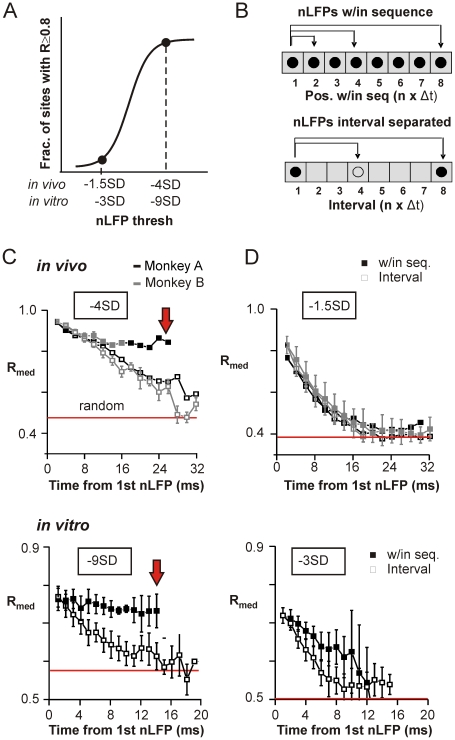
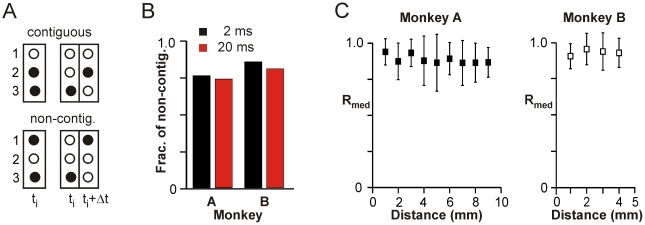
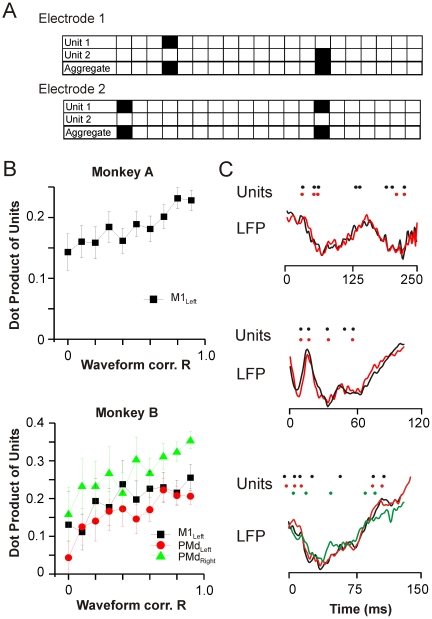
Transient associations among neurons are thought to underlie memory and behavior. However, little is known about how such associations occur or how they can be identified. Here we recorded ongoing local field potential (LFP) activity at multiple sites within the cortex of awake monkeys and organotypic cultures of cortex. We show that when the composite activity of a local neuronal group exceeds a threshold, its activity pattern, as reflected in the LFP, occurs without distortion at other cortex sites via fast synaptic transmission. These large-amplitude LFPs, which we call coherence potentials, extend up to hundreds of milliseconds and mark periods of loss-less spread of temporal and amplitude information much like action potentials at the single-cell level. However, coherence potentials have an additional degree of freedom in the diversity of their waveforms, which provides a high-dimensional parameter for encoding information and allows identification of particular associations. Such nonlinear behavior is analogous to the spread of ideas and behaviors in social networks.


Conflict of interest statement

The authors have declared that no competing interests exist.

Figures

Figure 1
Figure 1. Increasing nLFP amplitude is associated with a sigmoidal transition to a regime of widespread waveform similarity.
(A) The nLFP is defined as the complete negative excursion (thick line) from baseline or average activity (dotted line). Significant nLFPs are identified if they cross a negative threshold of n times the standard deviation (−n SD) estimated from the total time course of the recording. Amplitude and time of the nLFP correspond to the negative peak. (B) Schematic of nLFP triggered comparisons to time-aligned and best-match (up to ±n ms shifted in time) periods at each other electrode (left). As controls, nLFP triggered periods were compared to random periods of similar duration (middle). A priori similarities of LFP segments were estimated from random, time-aligned segments, whose duration distribution was matched to that of nLFP segments (right; see also D). Color code extends to (D) and (E). (C) Waveforms were compared by calculating the correlation R of the time series. Examples of simultaneous waveforms at two sites A and B with R = 0.5, 0.65, and 0.8. (D) Mean duration ±SD of the nLFP as a function of nLFP threshold (M1left; monkey A; average over all four arrays in monkey B; average of n = 6 cultures). (E) Distributions of correlation R (average across all electrodes) between nLFP triggered and time-aligned (black), nLFP triggered and random position (red), and random and time-aligned (green) periods as described in (B) shows a large fraction of correlated sites for nLFP triggers with threshold −4 SD in vivo (left; M1left; monkey A) and −9 SD in vitro (right; single culture). (F) The average fraction of highly correlated sites across events (i.e., R≥0.8, shaded area in Figure 1E) increases sigmoidally with nLFP amplitude beyond ∼1 SD (broken line; sigmoidal fit, R>0.99 all cases) and was significantly different from all controls (random, duration- and amplitude-matched; p<10−4 all cases). Best-match comparisons (shown here up to a maximum shift of ±10 ms) demonstrate higher correlations overall (open arrow: best-match comparison artificially increases the likelihood of finding highly correlated, short segments at low threshold within ±10 ms). Left: M1left; monkey A. Middle: average over all four arrays in monkey B. Right: average of n = 6 cultures.
Figure 2
Figure 2. Correlated waveforms are temporally clustered.
(A) Correlated periods with R≥0.8 occur within ±50 ms. Fraction of sites with best-match correlation R≥0.8 plateaus beyond ±50 ms as maximum shift is increased for up to ±200 ms (nLFP threshold of −4 SD in vivo and −9 SD in vitro; M1left, monkey A; average over four arrays in monkey B; average over n = 6 cultures). (B) The distribution of time differences between the trigger nLFP and highly correlated nLFPs at other electrodes is centered at 0. Time-shifts corresponding to best-match periods (red) correspond closely to the time difference between the peaks of the nLFP (peak-to-peak; black; M1left from monkey A). Inset: representative culture. (C) Highly correlated nLFPs occur within quick succession, less than 10 ms apart from each other. Density distribution of time intervals between successively correlated sites identified using nLFP triggers of −4 SD in vivo and −9 SD in vitro on any given electrode (M1left, monkey A; average over four arrays in monkey B; average over n = 6 cultures).
Figure 3
Figure 3. Correlated waveforms are similar in amplitude.
(A) Schematic of amplitude comparison where the peak amplitude within the time-aligned window at each site was normalized by the peak amplitude of the trigger nLFP (elecamp/nLFPtrigamp). Comparison of time-aligned random segments was used as a control (red). (B) Distributions of log-normalized values as in (A) for correlated waveforms with peaks ≤−4 SD from the M1left array in monkey A distribute narrowly around 0 (i.e., log 1). Inclusion of waveforms at all sites irrespective of correlation broadens the original distribution towards ratios <1. The sharp peak at 0 is absent in random segment comparisons. (C) Fraction of sites with peak amplitude within ±50% of the nLFP trigger amplitude (shaded area in B) increased non-linearly as a function of trigger amplitude and was significantly greater for correlated waveforms alone (see Figure S4 for monkey B and cultures).
Figure 4
Figure 4. Visualization of coherence potential sequences.
(A) Matrix of time delays for 100 suprathreshold nLFPs (≤−3 SD) that occurred in temporal succession on the array in M1Left of monkey A. Most nLFPs formed tight temporal clusters (“a”, “b”, …, “o”; black) that were well separated from successive clusters (i.e., >50 ms, white). Clusters are potential candidates for coherence potentials. The color coding for time delays was based on the range of delays between highly correlated nLFPs (R≥0.8; see Figure 2B) where ∼95% were <10 ms (black), ∼4% were between 10 and 25 ms (blackred), a fraction of a percent were between 25 and 50 ms (redgray), and virtually none were >150 ms (white). (B) Corresponding matrix of waveform correlations. nLFP waveforms within clusters (max. delay of 10 ms) tend to be highly similar (blackred; R≥0.8), i.e. coherence potentials. nLFPs between clusters (i.e., successive coherence potentials) were no more similar than random nLFPs (white). Color code for waveform similarity was based on the distribution of correlations for nLFP triggered and random time-aligned comparisons (cf., Figure 1E). Red: R≥0.8, correlations roughly around the peak in Figure 1E. Gray–white: 0.6<R<0.8, correlations between the peak of nLFP triggered comparisons and the intersection with random comparisons. White: R≤0.6, not distinguishable from random. (C) Over-plots of waveforms corresponding to clusters “a” through “o”. A coherence potential is composed of suprathreshold nLFPs from at least two sites on the array that are highly similar in waveform and amplitude. Note the similarity of nLFP waveforms within a coherence potential and the variability between successive coherence potentials. Asterisk: Single waveforms that fail the operational definition of a coherence potential, which requires at least two sites. Below: Details of cluster “n”. This cluster is characterized by waveforms with a relatively short-duration nLFP. Consequently, best-matched nLFP comparison only incompletely captures the similarity of the waveforms over the longer period of ∼300 ms. (D) An example of a time matrix for thirty successive suprathreshold nLFPs (≤−3 SD) in the same monkey later in time relative to (A) which shows less compact temporal clustering. (E) Corresponding correlations of nLFP waveforms from panel (D) reveal a “checkerboard” pattern within temporal clusters indicating an intermingling of a small number of distinct waveforms, i.e. temporally overlapping but spatially separated coherence potentials. (F) Over-plot of waveforms from temporal clusters “a” to “d” from panel (D). Although over-plots based on a simple temporal criterion (i.e., maximum delay of 10 ms) did not result in identical waveforms, sorting the waveforms based on a correlation threshold criterion (here R≥0.8) readily uncovers the multiple coherence potentials that were temporally intermingled. Thus, temporal cluster “a” is composed of five distinct waveform groups of which three were identified as coherence potentials, while temporal cluster “c” consisted of five distinct waveforms of which one grouped with cluster “b” and three with cluster “d” (color code indicates regrouping; asterisk: waveforms that fail the operational definition of a coherence potential).
Figure 5
Figure 5. Coherence potentials are spectrally diverse negative–positive waveforms.
(A) Sketch showing method of identifying periods around the nLFP for which sites maintained correlation of R≥0.8. Starting from the peak of an nLFP identified on a given electrode (≤−4 SD in vivo, ≤−9 SD in vitro) the period of time-aligned comparison (gray) was increased in each direction (arrows) up to ±500 ms or until R dropped below 0.8. Duration was taken as the combined period in both directions. (B) Durations distributed with a heavy tail spanning a wide range up to 500 ms with median values of 200 ms and 178±22 ms in monkey A (M1left) and monkey B (average of four arrays), respectively, and 92±12 ms in vitro (n = 6 cultures). (C) Corresponding distribution of the number of negative excursions over the duration of the correlations. Roughly 90% included only one baseline crossing indicating that correlated periods generally included part of one negative and one positive excursion. In the remaining fraction, periods with R≥0.8 extended over multiple negative excursions with exponentially decreasing likelihood. This demonstrates that the nLFP periods capture a large fraction of the full extent of the correlation around negative peaks validating our initial approach that focused on nLFPs. (D) Power spectrum density for correlated periods both in vivo (left, middle) and in vitro (right) shows a systematic decay with higher frequencies (black), similar to the power spectrum for non-correlated periods (red) and the complete recording (grey). (E) Coherence potentials involve specific phase relationships among frequencies. Median correlation (Rmed±SD) for coherence potentials (R≥0.8) after phase shuffling of their waveforms shows dramatic loss of correlation.
Figure 6
Figure 6. Spatial spread of similar waveforms depends on fast inhibitory and excitatory transmission.
(A) Reduced AMPA glutamate-receptor mediated excitation (2 µM DNQX) decreased the fraction of correlated sites at all thresholds (p<10−3, amplitude thresh ≤−2.5 SD; shown here and in B are the best-match values within a period of ±10 ms). Thresholds used in both cases correspond to the absolute amplitude values before drug. (B) DNQX also significantly reduced the amplitude similarity (i.e., amplitudes within 50% of the selected trigger) of highly correlated waveforms (R≥0.8) at all thresholds (p<10−5). (C) Reducing GABAA-receptor mediated inhibition (5 µM Picrotoxin, PTX) destroyed the sigmoidal increase in correlations with increasing amplitude, reducing the extent of correlations at high thresholds and increasing the extent of correlations at low thresholds. (D) Similar comparison as in (B) for n = 3 cultures before and in the presence of 5 µM PTX shows that amplitude similarity is also reduced under conditions of reduced fast inhibition (p<0.05). In addition, amplitude variability is increased as indicated by the larger error bars. (E) Examples of waveforms with amplitudes ≤−9 SD that are temporally clustered (<10 ms intervals) before (pre-drug) and in the presence of PTX (+PTX) demonstrate the substantial loss in waveform similarity when inhibition is reduced.
Figure 7
Figure 7. Large amplitude nLFPs propagate stably showing sequential dependence, while small amplitude nLFPs propagate with progressive distortion.
(A) nLFP sequences were constructed at two thresholds, before (left) and after the transition to high spatial coherence (right; cf., Figure 1F). (B) Comparisons were made between the first nLFP and nLFPs whose peaks occurred in consecutive time bins (i.e., in sequence; top) as well as between nLFPs separated by time-matched intervals (i.e., empty bins; bottom). (C) The median waveform correlation (Rmed) within a sequence of large amplitude nLFPs (≤−4 SD in vivo, top; ≤−9 SD in vitro, bottom) remained stable relative to the first nLFP (filled squares; red arrow), while correlations of nLFPs separated by similarly increasing intervals (open squares) decayed progressively to the median random value (random, red line). (M1left, monkey A; average over four arrays in monkey B; average over n = 6 cultures). (D) Rmed for sequences of small amplitude nLFPs (filled squares; ≤−1.5 SD in vivo, top and −3 SD in vitro, bottom) decayed relative to the first nLFP to no better than random (red line) similar to nLFPs separated by increasing intervals (open squares).
Figure 8
Figure 8. Coherence potentials propagate in saltatory fashion.
(A) Sketch of linear 3-electrode array showing an example of spatially contiguous (top) and non-contiguous (bottom) electrode activations for simultaneous (left) or successive (right) nLFPs at temporal resolution Δt. (B) More than 70% of coherence potentials in vivo whose peaks occurred either in the same or consecutive time bins were not at contiguous electrodes irrespective of the temporal bin size chosen (Δt = 2 ms and Δt = 20 ms shown). (C) The median correlation Rmed between pairs of nLFPs in vivo exceeding a threshold of −4 SD was not dependent on the distance between the electrodes on which they occurred. (M1left, monkey A; average over four arrays in monkey B).
Figure 9
Figure 9. Similarity in temporal pattern of unit activity increases with waveform similarity.
(A) Similarity of unit activity was calculated as the dot product of aggregate unit activity around the nLFP peak for different temporal bin widths. To control for duration and number of spikes, periods selected corresponded to coherence potentials of at least 200 ms duration with exactly two unit occurrences. Examples show aggregate unit activity at two electrodes leading to a dot product of 1 for a bin width of 10 ms. (B) Similarity in unit activity correlated positively with LFP waveform similarity in both monkeys. Dot product of aggregate unit activity of pairs of electrodes plotted as a function of the correlation of the LFP waveforms corresponding to the same period and electrodes. (C) Examples of highly correlated nLFPs on two or more electrodes with >3 units each that also had highly correlated unit activity.

Similar articles

Cited by

References

    1. Hebb D. O. The organization of behavior. New York: Wiley; 1949.
    1. Bressler S. L, Coppola R, Nakamura R. Episodic multiregional cortical coherence at multiple frequencies during visual task performance. Nature. 1993;366:153–156. - PubMed
    1. Gray C. M, Konig P, Engel A. K, Singer W. Oscillatory responses in cat visual cortex exhibit inter-columnar synchronization which reflects global stimulus properties. Nature. 1989;338:334–337. - PubMed
    1. Eckhorn R, Bauer R, Jordan W, Brosch M, Kruse W, et al. Coherent oscillations: a mechanism of feature linking in the visual cortex? Multiple electrode and correlation analyses in the cat. Biol Cybern. 1988;60:121–130. - PubMed
    1. Aertsen A. M, Gerstein G. L, Habib M. K, Palm G. Dynamics of neuronal firing correlation: modulation of “effective connectivity”. J Neurophysiol. 1989;61:900–917. - PubMed

Publication types