. 2010 Jan 15;6(1):e1000814.
doi: 10.1371/journal.pgen.1000814.

A comprehensive map of insulator elements for the Drosophila genome

Affiliations

A comprehensive map of insulator elements for the Drosophila genome

Nicolas Nègre et al. PLoS Genet. .

Abstract

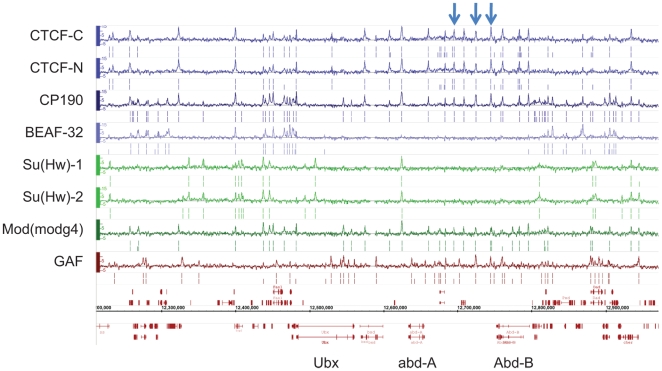
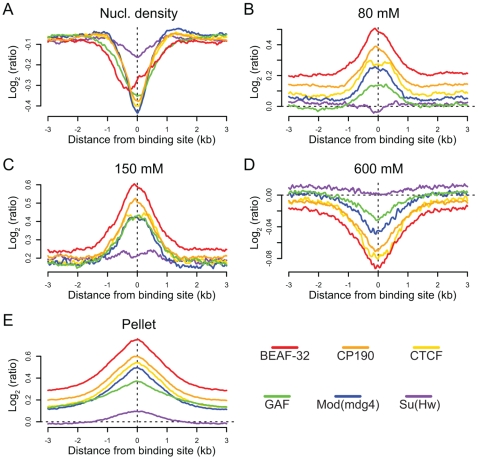
Insulators are DNA sequences that control the interactions among genomic regulatory elements and act as chromatin boundaries. A thorough understanding of their location and function is necessary to address the complexities of metazoan gene regulation. We studied by ChIP-chip the genome-wide binding sites of 6 insulator-associated proteins-dCTCF, CP190, BEAF-32, Su(Hw), Mod(mdg4), and GAF-to obtain the first comprehensive map of insulator elements in Drosophila embryos. We identify over 14,000 putative insulators, including all classically defined insulators. We find two major classes of insulators defined by dCTCF/CP190/BEAF-32 and Su(Hw), respectively. Distributional analyses of insulators revealed that particular sub-classes of insulator elements are excluded between cis-regulatory elements and their target promoters; divide differentially expressed, alternative, and divergent promoters; act as chromatin boundaries; are associated with chromosomal breakpoints among species; and are embedded within active chromatin domains. Together, these results provide a map demarcating the boundaries of gene regulatory units and a framework for understanding insulator function during the development and evolution of Drosophila.


Conflict of interest statement

The authors have declared that no competing interests exist.

Figures

Figure 1
Figure 1. Binding profile of insulator-associated proteins in Drosophila.
Binding profile of the 6 proteins studied on a large region of the chromosome 3R including the Bithorax-Complex, which contains 3 well-characterized insulators (blue arrows). For each protein, the track depicts the MAT score of each probe plotted on the y-axis versus chromosomal position, plotted along the x-axis. Called binding sites at 1% and 5% FDR are marked below each track. Note CTCF-C/CTCF-N and Su(Hw)-1/Su(Hw)-2 represent data from 2 independent antibodies. Flybase annotated genes are represented in red as the two bottom tracks.
Figure 2
Figure 2. Combinatorial protein binding on insulators.
For each insulator, intergenic bound regions were determined using the peaks ±100 bp (as described in Motif Discovery methods). The enrichment or depletion of instances of each motif with respect to these peak regions for each insulator is determined using a hypergeometric p-value as compared to control instances at 0.0 confidence, using (A) all bound regions for a particular protein or (B) peaks whose center is at least 1 kb away from the peak of any other insulator (uniquely bound regions). (C) All binding sites for all 6 insulator proteins have been classified based on their protein composition. Each of the categories is represented in the matrix as a black square for the factors associated with the binding site. The number of occurrences of each particular combination is indicated at the right of the matrix. The yellow to blue squares at the left of the matrix represent the enrichment or depletion p-value for each category when compared to simulated data. This matrix and the significant associations of factors have been use to build the dendrogram at the top of the figure.
Figure 3
Figure 3. Insulator proteins are enriched between promoters.
Plot of log2 enrichment or depletion of insulator binding sites (y-axis) by binding site base pair position (x-axis), relative to genomic transcript annotations. (A) Transcription start sites; negative and positive values depict upstream and downstream binding, respectively. (B) Transcription end sites; negative and positive values depict upstream and downstream binding. (C–E) Enrichment of insulator binding sites between adjacent promoters (C), divergent promoters (D), and alternative promoters (E). Points and lines depict enrichment estimates and 95% confidence intervals. A dotted line at 0 indicates no enrichment relative to the random expectation.
Figure 4
Figure 4. Insulator proteins segregate differentially expressed promoters.
Log2 enrichment or depletion of insulator binding sites between (A) adjacent promoters, (B) divergently transcribed promoters, (C) alternative promoters, and (D) cis-regulatory elements and promoters. (A–C) X and Y axes depict enrichment between differentially and non-differentially expressed promoters, respectively. (D) X and Y axes depict enrichment between CRMs and their nearest non-target promoter and their target promoter. Points and lines depict enrichment estimates and 95% confidence intervals.
Figure 5
Figure 5. Insulator proteins mark chromatin and syntenic block boundaries.
Log2 enrichment or depletion of insulator binding sites. (A) H3K27me3 boundaries; negative and positive values depict binding within and outside regions of histone modification. (B) Syntenic breakpoints; negative and positive values depict binding within and outside syntenic blocks.
Figure 6
Figure 6. Insulators are sites of dynamic chromatin.
Nucleosome density and salt fractionation profiles for Drosophila S2 cell chromatin, aligned at sites of insulator protein binding as indicated by color and averaged over a ±3 kb region. (A) nucleosome density, (B) 80 mM salt fraction, (C) 150 mM salt fraction (D) 600 mM salt fraction, (E) salt-washed pellet.
Figure 7
Figure 7. Class I insulators demarcate regulatory boundaries in the Antennapedia Complex (ANT-C) region.
Binding sites for insulator proteins are depicted as colored boxes at top. For display purposes, grey vertical lines are drawn through all positions bound by two or more class I insulators. ORegAnno (www.oreganno.org) defined cis-regulatory modules for each of 9 genes are plotted as black boxes across the middle. RefSeq (www.ncbi.nlm.nih.gov/RefSeq/) gene models and coordinates across the 500 kb Antp region are displayed at bottom.

Similar articles

Cited by

References

    1. Kellum R, Schedl P. A position-effect assay for boundaries of higher order chromosomal domains. Cell. 1991;64:941–950. - PubMed
    1. Kellum R, Schedl P. A group of scs elements function as domain boundaries in an enhancer-blocking assay. Mol Cell Biol. 1992;12:2424–2431. - PMC - PubMed
    1. Holdridge C, Dorsett D. Repression of hsp70 heat shock gene transcription by the suppressor of hairy-wing protein of Drosophila melanogaster. Mol Cell Biol. 1991;11:1894–1900. - PMC - PubMed
    1. Geyer PK, Corces VG. DNA position-specific repression of transcription by a Drosophila zinc finger protein. Genes Dev. 1992;6:1865–1873. - PubMed
    1. Wallace JA, Felsenfeld G. We gather together: insulators and genome organization. Curr Opin Genet Dev. 2007;17:400–407. - PMC - PubMed

Publication types

Substances

Associated data