

Growth rate consequences of coloniality in a harmful phytoplankter
- PMID: 20084114
- PMCID: PMC2799676
- DOI: 10.1371/journal.pone.0008679
Growth rate consequences of coloniality in a harmful phytoplankter
Abstract
Background: Allometric studies have shown that individual growth rate is inversely related to body size across a broad spectrum of organisms that vary greatly in size. Fewer studies have documented such patterns within species. No data exist directly documenting the influence of colony size on growth rate for microscopic, colonial organisms.
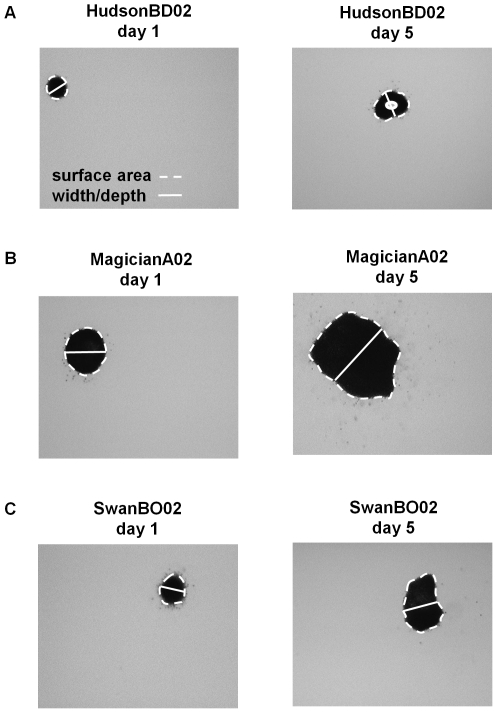
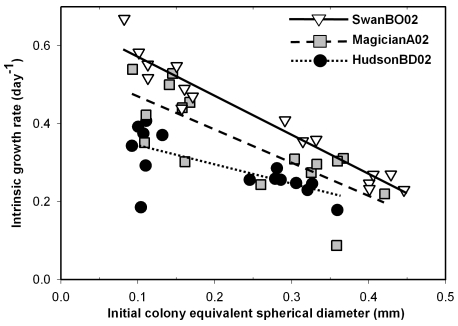
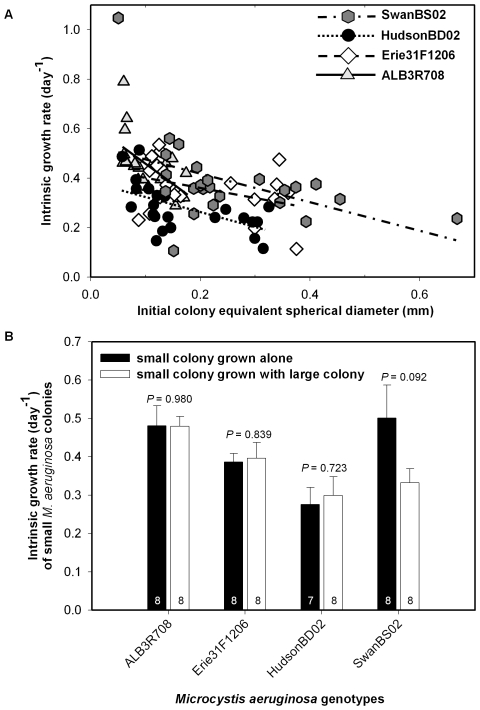
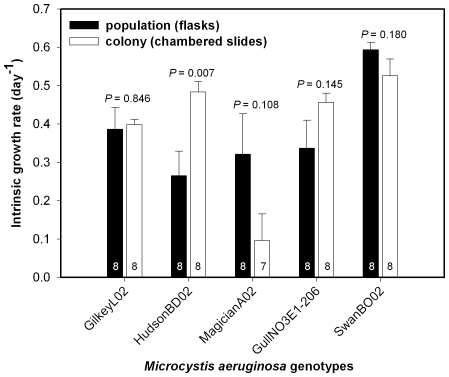
Methodology/principal findings: To determine if similar negative relationships between growth rate and size hold for colonial organisms, we developed a technique for measuring the growth of individual colonies of a bloom-forming, toxic cyanobacterium, Microcystis aeruginosa using microscopy and digital image analysis. For five out of six genotypes of M. aeruginosa isolated from lakes in Michigan and Alabama, we found significant negative relationships between colony size and growth rate. We found large intraspecific variation in both the slope of these relationships and in the growth rate of colonies at a standard size. In addition, growth rate estimates for individual colonies were generally consistent with population growth rates measured using standard batch culture.
Conclusions/significance: Given that colony size varies widely within populations, our results imply that natural populations of colonial phytoplankton exist as a mosaic of individuals with widely varying ecological attributes (since size strongly affects growth rate, grazing mortality, and migration speed). Quantifying the influence of colony size on growth rate will permit development of more accurate, predictive models of ecological interactions (e.g., competition, herbivory) and their role in the proliferation of harmful algal blooms, in addition to increasing our understanding about why these interactions vary in strength within and across environments.
Conflict of interest statement
Figures
Similar articles
-
Genome evolution and host-microbiome shifts correspond with intraspecific niche divergence within harmful algal bloom-forming Microcystis aeruginosa.Mol Ecol. 2019 Sep;28(17):3994-4011. doi: 10.1111/mec.15198. Epub 2019 Aug 22. Mol Ecol. 2019. PMID: 31344288
-
Colony formation in the cyanobacterium Microcystis.Biol Rev Camb Philos Soc. 2018 Aug;93(3):1399-1420. doi: 10.1111/brv.12401. Epub 2018 Feb 22. Biol Rev Camb Philos Soc. 2018. PMID: 29473286
-
Feedback Regulation between Aquatic Microorganisms and the Bloom-Forming Cyanobacterium Microcystis aeruginosa.Appl Environ Microbiol. 2019 Oct 16;85(21):e01362-19. doi: 10.1128/AEM.01362-19. Print 2019 Nov 1. Appl Environ Microbiol. 2019. PMID: 31420344 Free PMC article.
-
Genetic variation of the bloom-forming Cyanobacterium Microcystis aeruginosa within and among lakes: implications for harmful algal blooms.Appl Environ Microbiol. 2005 Oct;71(10):6126-33. doi: 10.1128/AEM.71.10.6126-6133.2005. Appl Environ Microbiol. 2005. PMID: 16204530 Free PMC article.
-
Review: a meta-analysis comparing cell-division and cell-adhesion in Microcystis colony formation.Harmful Algae. 2017 Jul;67:85-91. doi: 10.1016/j.hal.2017.06.007. Epub 2017 Jul 8. Harmful Algae. 2017. PMID: 28755723
Cited by
-
Comparison of photoacclimation in twelve freshwater photoautotrophs (chlorophyte, bacillaryophyte, cryptophyte and cyanophyte) isolated from a natural community.PLoS One. 2013;8(3):e57139. doi: 10.1371/journal.pone.0057139. Epub 2013 Mar 19. PLoS One. 2013. PMID: 23526934 Free PMC article.
-
Competition between toxic and non-toxic Microcystis aeruginosa and its ecological implication.Ecotoxicology. 2015 Oct;24(7-8):1411-8. doi: 10.1007/s10646-015-1456-2. Epub 2015 Apr 8. Ecotoxicology. 2015. PMID: 25850752
-
Effects of calcium levels on colonial aggregation and buoyancy of Microcystis aeruginosa.Curr Microbiol. 2011 Feb;62(2):679-83. doi: 10.1007/s00284-010-9762-7. Epub 2010 Sep 26. Curr Microbiol. 2011. PMID: 20872220
-
Green algal over cyanobacterial dominance promoted with nitrogen and phosphorus additions in a mesocosm study at Lake Taihu, China.Environ Sci Pollut Res Int. 2015 Apr;22(7):5041-9. doi: 10.1007/s11356-014-3930-4. Epub 2014 Dec 18. Environ Sci Pollut Res Int. 2015. PMID: 25516247
-
Evolution of reproductive strategies in incipient multicellularity.J R Soc Interface. 2022 Mar;19(188):20210716. doi: 10.1098/rsif.2021.0716. Epub 2022 Mar 2. J R Soc Interface. 2022. PMID: 35232276 Free PMC article.
References
-
- Niklas KJ. Chicago: The University of Chicago Press; 1994. Plant allometry: the scaling of form and process.
-
- Reich PB. Body size, geometry, longevity and metabolism: do plant leaves behave like a animal bodies? Trends in Ecology & Evolution. 2001;16:674–680.
-
- West GB, Brown JH. The origin of allometric scaling laws in biology from genomes to ecosystems: towards a quantitative unifying theory of biological structure and organization. Journal of Experimental Biology. 2005;208:1575–1592. - PubMed
-
- Schmidt-Nielsen K. Cambridge, London, New York, New Rochelle, Melbourne, Sydney: Cambridge University Press; 1984. Scaling, Why is animal size so important.
-
- West GB, Brown JH, Enquist BJ. A general model for the origin of allometric scaling laws in biology. Science. 1997;276:122–126. - PubMed
Publication types
MeSH terms
LinkOut - more resources
Full Text Sources
