

Genome-wide analyses of gene expression during mouse endochondral ossification
- PMID: 20084171
- PMCID: PMC2805713
- DOI: 10.1371/journal.pone.0008693
Genome-wide analyses of gene expression during mouse endochondral ossification
Abstract
Background: Endochondral ossification is a complex process involving a series of events that are initiated by the establishment of a chondrogenic template and culminate in its replacement through the coordinated activity of osteoblasts, osteoclasts and endothelial cells. Comprehensive analyses of in vivo gene expression profiles during these processes are essential to obtain a complete understanding of the regulatory mechanisms involved.
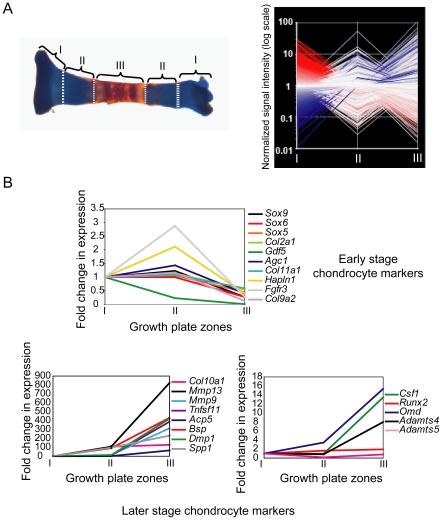
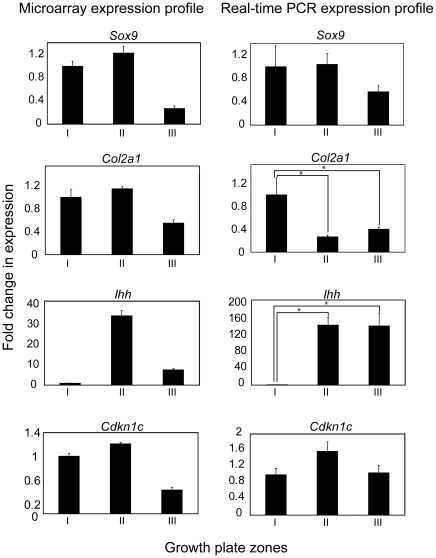
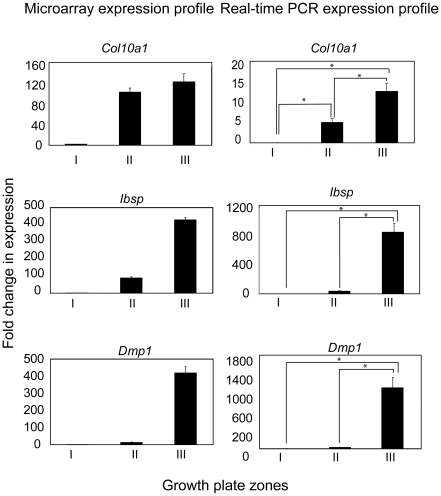
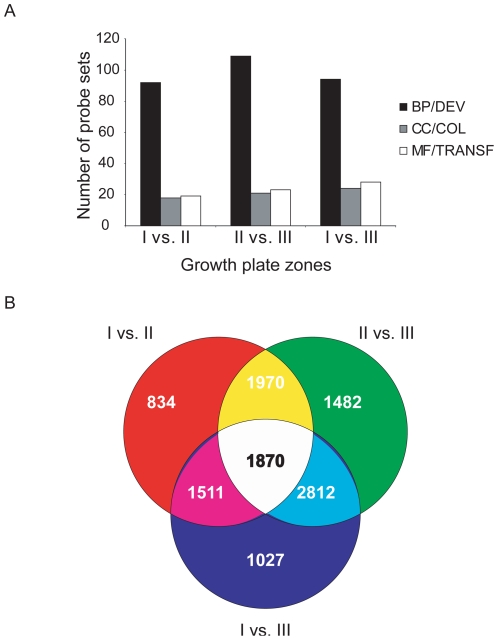
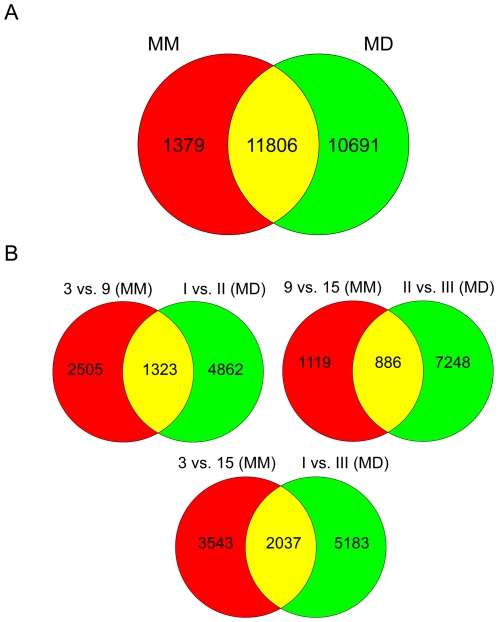
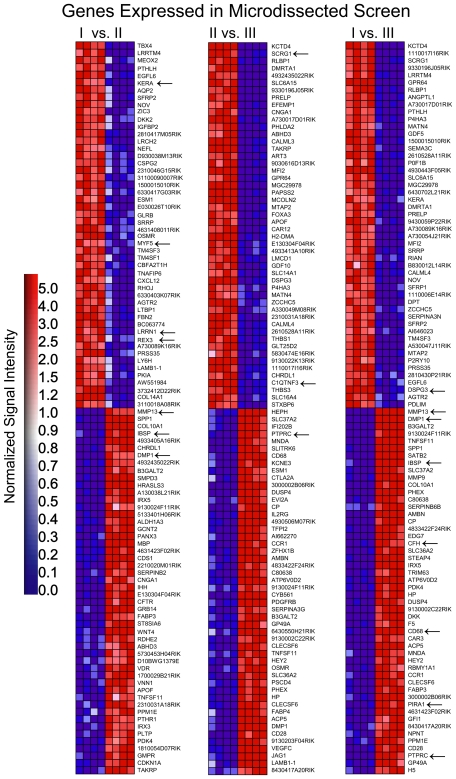
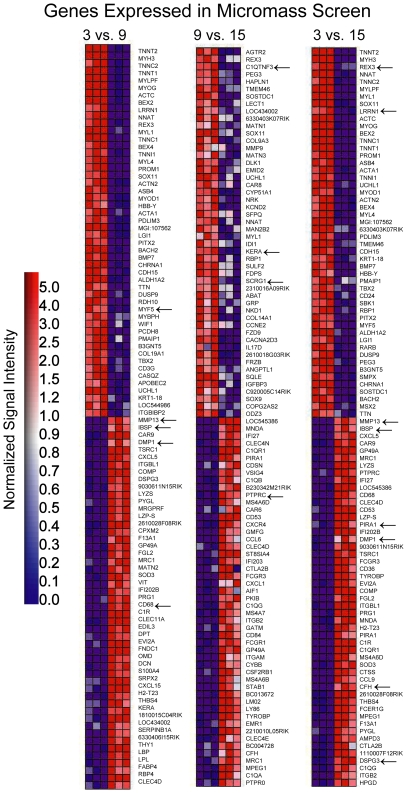
Methodology/principal findings: To address these issues, we completed a microarray screen of three zones derived from manually segmented embryonic mouse tibiae. Classification of genes differentially expressed between each respective zone, functional categorization as well as characterization of gene expression patterns, cytogenetic loci, signaling pathways and functional motifs both confirmed reported data and provided novel insights into endochondral ossification. Parallel comparisons of the microdissected tibiae data set with our previously completed micromass culture screen further corroborated the suitability of micromass cultures for modeling gene expression in chondrocyte development. The micromass culture system demonstrated striking similarities to the in vivo microdissected tibiae screen; however, the micromass system was unable to accurately distinguish gene expression differences in the hypertrophic and mineralized zones of the tibia.
Conclusions/significance: These studies allow us to better understand gene expression patterns in the growth plate and endochondral bones and provide an important technical resource for comparison of gene expression in diseased or experimentally-manipulated cartilages. Ultimately, this work will help to define the genomic context in which genes are expressed in long bones and to understand physiological and pathological ossification.
Conflict of interest statement
Figures
Similar articles
-
Regulation of gene expression by PI3K in mouse growth plate chondrocytes.PLoS One. 2010 Jan 25;5(1):e8866. doi: 10.1371/journal.pone.0008866. PLoS One. 2010. PMID: 20111593 Free PMC article.
-
Expression profiling of Dexamethasone-treated primary chondrocytes identifies targets of glucocorticoid signalling in endochondral bone development.BMC Genomics. 2007 Jul 1;8:205. doi: 10.1186/1471-2164-8-205. BMC Genomics. 2007. PMID: 17603917 Free PMC article.
-
The PI3K pathway regulates endochondral bone growth through control of hypertrophic chondrocyte differentiation.BMC Dev Biol. 2008 Apr 11;8:40. doi: 10.1186/1471-213X-8-40. BMC Dev Biol. 2008. PMID: 18405384 Free PMC article.
-
Transcriptional networks controlling chondrocyte proliferation and differentiation during endochondral ossification.Pediatr Nephrol. 2010 Apr;25(4):625-31. doi: 10.1007/s00467-009-1368-6. Epub 2009 Dec 1. Pediatr Nephrol. 2010. PMID: 19949815 Review.
-
The skeleton: a multi-functional complex organ: the growth plate chondrocyte and endochondral ossification.J Endocrinol. 2011 Nov;211(2):109-21. doi: 10.1530/JOE-11-0048. Epub 2011 Jun 3. J Endocrinol. 2011. PMID: 21642379 Review.
Cited by
-
Lineage-specific differences and regulatory networks governing human chondrocyte development.Elife. 2023 Mar 15;12:e79925. doi: 10.7554/eLife.79925. Elife. 2023. PMID: 36920035 Free PMC article.
-
Synergistic co-regulation and competition by a SOX9-GLI-FOXA phasic transcriptional network coordinate chondrocyte differentiation transitions.PLoS Genet. 2018 Apr 16;14(4):e1007346. doi: 10.1371/journal.pgen.1007346. eCollection 2018 Apr. PLoS Genet. 2018. PMID: 29659575 Free PMC article.
-
Histone deacetylase 4 deletion results in abnormal chondrocyte hypertrophy and premature ossification from collagen type 2α1‑expressing cells.Mol Med Rep. 2020 Nov;22(5):4031-4040. doi: 10.3892/mmr.2020.11465. Epub 2020 Aug 27. Mol Med Rep. 2020. PMID: 33000215 Free PMC article.
-
Computational Modeling and Reverse Engineering to Reveal Dominant Regulatory Interactions Controlling Osteochondral Differentiation: Potential for Regenerative Medicine.Front Bioeng Biotechnol. 2018 Nov 13;6:165. doi: 10.3389/fbioe.2018.00165. eCollection 2018. Front Bioeng Biotechnol. 2018. PMID: 30483498 Free PMC article. Review.
-
Changes in matrix protein gene expression associated with mineralization in the differentiating chick limb-bud micromass culture system.J Cell Biochem. 2011 Feb;112(2):607-13. doi: 10.1002/jcb.22951. J Cell Biochem. 2011. PMID: 21268082 Free PMC article.
References
-
- de Crombrugghe B, Lefebvre V, Nakashima K. Regulatory mechanisms in the pathways of cartilage and bone formation. Curr Opin Cell Biol. 2001;13:721–727. - PubMed
-
- Mariani FV, Martin GR. Deciphering skeletal patterning: clues from the limb. Nature. 2003;423:319–325. - PubMed
-
- Horner A, Shum L, Ayres JA, Nonaka K, Nuckolls GH. Fibroblast growth factor signaling regulates Dach1 expression during skeletal development. Dev Dyn. 2002;225:35–45. - PubMed
-
- Wakui M, Yamaguchi A, Sakurai D, Ogasawara K, Yokochi T, et al. Genes highly expressed in the early phase of murine graft-versus-host reaction. Biochem Biophys Res Commun. 2001;282:200–206. - PubMed
-
- O'Keefe RJ, Puzas JE, Loveys L, Hicks DG, Rosier RN. Analysis of type II and type X collagen synthesis in cultured growth plate chondrocytes by in situ hybridization: rapid induction of type X collagen in culture. J Bone Miner Res. 1994;9:1713–1722. - PubMed
Publication types
MeSH terms
Substances
Grants and funding
LinkOut - more resources
Full Text Sources
Molecular Biology Databases
