. 2010 Jan 13;5(1):e8668.
doi: 10.1371/journal.pone.0008668.

The identification of markers of macrophage differentiation in PMA-stimulated THP-1 cells and monocyte-derived macrophages

Affiliations

The identification of markers of macrophage differentiation in PMA-stimulated THP-1 cells and monocyte-derived macrophages

Marc Daigneault et al. PLoS One. .

Abstract

Differentiated macrophages are the resident tissue phagocytes and sentinel cells of the innate immune response. The phenotype of mature tissue macrophages represents the composite of environmental and differentiation-dependent imprinting. Phorbol-12-myristate-13-acetate (PMA) and 1,25-dihydroxyvitamin D3 (VD(3)) are stimuli commonly used to induce macrophage differentiation in monocytic cell lines but the extent of differentiation in comparison to primary tissue macrophages is unclear. We have compared the phenotype of the promonocytic THP-1 cell line after various protocols of differentiation utilising VD(3) and PMA in comparison to primary human monocytes or monocyte-derived macrophages (MDM). Both stimuli induced changes in cell morphology indicative of differentiation but neither showed differentiation comparable to MDM. In contrast, PMA treatment followed by 5 days resting in culture without PMA (PMAr) increased cytoplasmic to nuclear ratio, increased mitochondrial and lysosomal numbers and altered differentiation-dependent cell surface markers in a pattern similar to MDM. Moreover, PMAr cells showed relative resistance to apoptotic stimuli and maintained levels of the differentiation-dependent anti-apoptotic protein Mcl-1 similar to MDM. PMAr cells retained a high phagocytic capacity for latex beads, and expressed a cytokine profile that resembled MDM in response to TLR ligands, in particular with marked TLR2 responses. Moreover, both MDM and PMAr retained marked plasticity to stimulus-directed polarization. These findings suggest a modified PMA differentiation protocol can enhance macrophage differentiation of THP-1 cells and identify increased numbers of mitochondria and lysosomes, resistance to apoptosis and the potency of TLR2 responses as important discriminators of the level of macrophage differentiation for transformed cells.


Conflict of interest statement

Competing Interests: The authors have declared that no competing interests exist.

Figures

Figure 1
Figure 1. Morphological changes of macrophages with differentiation.
Representative differential interface contrast image (A), forward light scatter and side light scatter plot (B) and histograms of autofluorescence, with the mean fluorescence intensity shown in the upper right hand corner, (C) of THP-1 cells untreated, treated with Vitamin D3 (VD3), PMA or treated with PMA and subsequent resting (PMAr), and of monocytes (Mo) or monocyte-derived macrophages (MDM). Data is representative of at least three independent experiments.
Figure 2
Figure 2. Increasing numbers of lysosomes and mitochondria with macrophage differentiation.
Representative confocal images after LysoTracker staining for lysosomes and MitoTracker staining for mitochondria in THP-1 cells treated with Vitamin D3 (VD3) or PMA treated and rested (PMAr) and monocytes (Mo) or monocyte-derived macrophages (MDM), (A). Median fluorescence intensity (MFI) after staining with LysoTracker (B) or Mitotracker (C) and analysis by flow cytometry, n = 5, ns p>0.05, * p<0.05, ** p<0.01, *** p<0.001, ANOVA.
Figure 3
Figure 3. Cell surface marker expression with macrophage differentiation.
Graph of median fluorescent intensity (MFI) of CD14 (A) and TLR2 (B) expressed on the cell surface of THP-1 cells untreated (UT), treated with Vitamin D3 (VD3) or PMA treatment with resting (PMAr) and monocytes (Mo) or monocyte-derived macrophages (MDM), n = 3–5, ns p>0.05, * p<0.05, **, p<0.01, *** p<0.001, Mann-Whitney U test.
Figure 4
Figure 4. Apoptosis susceptibility is decreased with macrophage differentiation.
Graph of percent fragmented nuclei by fluorescence microscopy 4 hr after UV exposure stained with DAPI (A) and relative caspase 3/7 activation 16 hr after staurosporine treatment (B) of THP-1 cells treated with Vitamin D3 (VD3) or PMA and rested (PMAr) and monocytes (Mo) or monocyte-derived macrophages (MDM), n = 3–6, † p<0.05, ††† p<0.001, two-way ANOVA with Bonferroni post tests; ns p>0.05, * p<0.05, ** p<0.01, *** p<0.001, ‡‡ p<0.01 vs. MDM, ANOVA with Bonferroni post tests.
Figure 5
Figure 5. Mcl-1 upregulation with macrophage differentiation.
Representative Western blot probed for Mcl-1, Bax and β-actin from THP-1 cells untreated, treated with Vitamin D3 (VD3) or PMA and rested (PMAr) and monocytes (Mo) or monocyte-derived macrophages (MDM) following culture in the absence (−) or presence(+) of staurosporine (ST) for 16 h. Data is representative of three independent experiments.
Figure 6
Figure 6. Phagocytosis of latex beads in macrophages.
THP-1 cells treated with Vitamin D3 (VD3) or PMA and rested (PMAr) and monocytes (Mo) or monocyte-derived macrophages (MDM) were challenged with latex beads and phagocytosis measured by flow cytometry. Histograms depict representative data from four independent experiments. MFI for the illustrated experiments were as follows: VD3 (317), PMAr (68.8), monocytes (2228) and MDM (919).
Figure 7
Figure 7. Differential cytokine expression with macrophage differentiation.
THP-1 cells treated with Vitamin D3 (VD3) or PMA and rested (PMAr) and monocytes (Mo) or monocyte-derived macrophages (MDM) were stimulated with LPS or Pam3CSK4. IL-1β (A and B) and TNF-α (C and D) were measured from supernatants, n = 5–9, † p<0.05, †† p<0.01, ††† p<0.001, two-way ANOVA with Bonferroni post tests; * p<0.05, ** p<0.01, *** p<0.001, ANOVA with Bonferroni post tests.
Figure 8
Figure 8. Low NO production in differentiated macrophages.
THP-1 cells treated with Vitamin D3 (VD3) or PMA and rested (PMAr) and monocytes (Mo) or monocyte-derived macrophages (MDM) were stimulated with LPS and NO detected by DAF-FM staining and flow cytometry, n = 4, * p<0.05, Mann-Whitney U test.
Figure 9
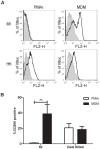
Figure 9. Differentiated Macrophages retain plasticity of polarization.
THP-1 cells treated with PMA and rested (PMAr) and monocyte-derived macrophages (MDM) were cultured in the absence (MI) or presence of heat killed pneumococci (HK) and expression of the macrophage mannose receptor (CD206) detected by flow cytometry. Data shows representative histogram overlays of isotype (filled histogram) and CD206 stained cells (transparent histogram) (A) with the percentage CD206 positive cells (B), n = 3, ** p<0.01, two-way ANOVA with Bonferroni post tests.

References

    1. Gordon S, Taylor PR. Monocyte and macrophage heterogeneity. Nat Rev Immunol. 2005;5:953–964. - PubMed
    1. Murphy J, Summer R, Wilson AA, Kotton DN, Fine A. The prolonged life-span of alveolar macrophages. Am J Respir Cell Mol Biol. 2008;38:380–385. - PMC - PubMed
    1. van oud Alblas AB, van Furth R. Origin, Kinetics, and characteristics of pulmonary macrophages in the normal steady state. J Exp Med. 1979;149:1504–1518. - PMC - PubMed
    1. Landsman L, Jung S. Lung macrophages serve as obligatory intermediate between blood monocytes and alveolar macrophages. J Immunol. 2007;179:3488–3494. - PubMed
    1. Mosser DM, Edwards JP. Exploring the full spectrum of macrophage activation. Nat Rev Immunol. 2008;8:958–969. - PMC - PubMed

Publication types